Network Management Protocols and Features
![]() Proper network management is a critical component of an efficient network. Network administrators need tools to monitor the functionality of the network devices, the connections between them, and the services they provide. SNMP has become the de facto standard for use in network management solutions and is tightly connected with remote monitoring (RMON) and Management Information Bases (MIB). Each managed device in the network has several variables that quantify the state of the device. You can monitor managed devices by reading the values of these variables, and you can control managed devices by writing values into these variables.
Proper network management is a critical component of an efficient network. Network administrators need tools to monitor the functionality of the network devices, the connections between them, and the services they provide. SNMP has become the de facto standard for use in network management solutions and is tightly connected with remote monitoring (RMON) and Management Information Bases (MIB). Each managed device in the network has several variables that quantify the state of the device. You can monitor managed devices by reading the values of these variables, and you can control managed devices by writing values into these variables.
![]() This section introduces SNMP and describes the differences between SNMP versions 1, 2, and 3. The role of MIBs in SNMP and RMON monitoring is described, and Cisco’s network discovery protocol, Cisco Discovery Protocol (CDP), is introduced. The section concludes with a description of methods for gathering network statistics.
This section introduces SNMP and describes the differences between SNMP versions 1, 2, and 3. The role of MIBs in SNMP and RMON monitoring is described, and Cisco’s network discovery protocol, Cisco Discovery Protocol (CDP), is introduced. The section concludes with a description of methods for gathering network statistics.
 Network Management Architecture
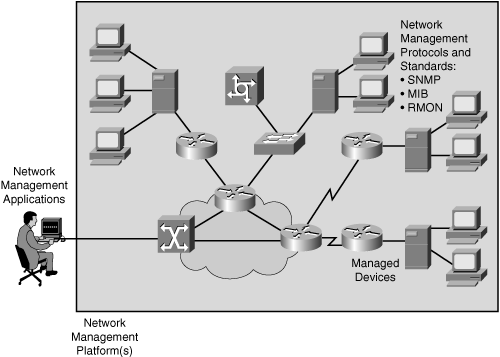
![]() Figure 3-25 illustrates a generic network management architecture.
Figure 3-25 illustrates a generic network management architecture.
![]() The network management architecture consists of the following:
The network management architecture consists of the following:
-
 Network management system (NMS): A system that executes applications that monitor and control managed devices. NMSs provide the bulk of the processing and memory resources that are required for network management.
 -
 Network management protocol: A protocol that facilitates the exchange of management information between the NMS and managed devices, including SNMP, MIB, and RMON.
 -
 Managed devices: A device (such as a router) managed by an NMS.
 -
 Management agents: Software, on managed devices, that collects and stores management information, including SNMP agents and RMON agents.
 -
 Management information: Data that is of interest to a device’s management, usually stored in MIBs.
![]() A variety of network management applications can be used on a network management system; the choice depends on the network platform (such as the hardware or operating system). The management information resides on network devices; management agents that reside on the device collect and store data in a standardized data definition structure known as the MIB.
A variety of network management applications can be used on a network management system; the choice depends on the network platform (such as the hardware or operating system). The management information resides on network devices; management agents that reside on the device collect and store data in a standardized data definition structure known as the MIB.
![]() The network management application uses SNMP or other network management protocols to retrieve the data that the management agents collect. The retrieved data is typically processed and prepared for display with a GUI, which allows the operator to use a graphical representation of the network to control managed devices and program the network management application.
The network management application uses SNMP or other network management protocols to retrieve the data that the management agents collect. The retrieved data is typically processed and prepared for display with a GUI, which allows the operator to use a graphical representation of the network to control managed devices and program the network management application.
Protocols and Standards
![]() Several protocols are used within the network management architecture.
Several protocols are used within the network management architecture.
| Note |
|
![]() The following sections discuss SNMP, MIB, and RMON in detail.
The following sections discuss SNMP, MIB, and RMON in detail.
 SNMP
SNMP
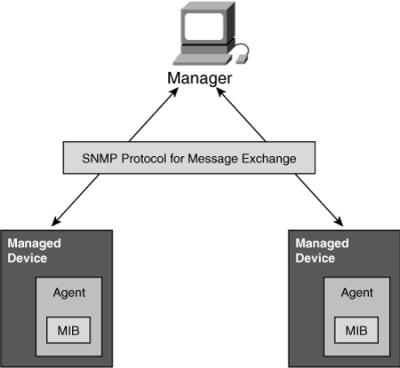
![]() SNMP has become the de facto standard for network management. SNMP is a simple solution that requires little code to implement, which enables vendors to easily build SNMP agents for their products. In addition, SNMP is often the foundation of the network management architecture. SNMP defines how management information is exchanged between network management applications and management agents. Figure 3-26 shows the terms used in SNMP; they are described as follows:
SNMP has become the de facto standard for network management. SNMP is a simple solution that requires little code to implement, which enables vendors to easily build SNMP agents for their products. In addition, SNMP is often the foundation of the network management architecture. SNMP defines how management information is exchanged between network management applications and management agents. Figure 3-26 shows the terms used in SNMP; they are described as follows:
-
 Manager: The manager, a network management application in an NMS, periodically polls the SNMP agents that reside on managed devices for the data, thereby enabling information to be displayed using a GUI on the NMS. A disadvantage of periodic SNMP polling is the possible delay between when an event occurs and when it is collected by the NMS; there is a trade-off between polling frequency and bandwidth usage.
 -
 Protocol: SNMP is a protocol for message exchange. It uses the User Datagram Protocol (UDP) transport mechanism to send and retrieve management information, such as MIB variables.
 -
 Managed device: A device (such as a router) managed by the manager.
 -
 Management agents: SNMP management agents reside on managed devices to collect and store a range of information about the device and its operation, respond to the manager’s requests, and generate traps to inform the manager about certain events. SNMP traps are sent by management agents to the NMS when certain events occur. Trap notifications could result in substantial network and agent resource savings by eliminating the need for some SNMP polling requests.
 -
 MIB: The management agent collects data and stores it locally in the MIB, a database of objects about the device. Community strings, which are similar to passwords, control access to the MIB. To access or set MIB variables, the user must specify the appropriate read or write community string; otherwise, access is denied.
SNMPv1
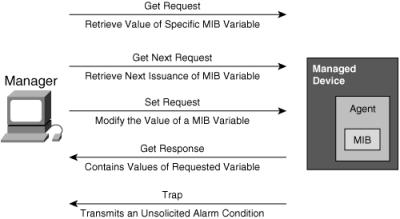
![]() The initial version of SNMP, SNMPv1 is defined in RFC 1157, Simple Network Management Protocol (SNMP). The protocol’s simplicity is apparent by the set of operations that are available. Figure 3-27 shows the basic SNMP messages, which the manager uses to transfer data from agents that reside on managed devices. These messages are described as follows:
The initial version of SNMP, SNMPv1 is defined in RFC 1157, Simple Network Management Protocol (SNMP). The protocol’s simplicity is apparent by the set of operations that are available. Figure 3-27 shows the basic SNMP messages, which the manager uses to transfer data from agents that reside on managed devices. These messages are described as follows:
-
 Get Request: Used by the manager to request a specific MIB variable from the agent.
 -
 Get Next Request: Used after the initial get request to retrieve the next object instance from a table or list.
 -
 Set Request: Used to set a MIB variable on an agent.
 -
 Get Response: Used by an agent to respond to a manager’s Get Request or Get Next Request message.
 -
 Trap: Used by an agent to transmit an unsolicited alarm to the manager. A Trap message is sent when specific conditions occur, such as a change in the state of a device, a device or component failure, or an agent initialization or restart.
SNMPv2
![]() SNMPv2 is a revised protocol that includes performance and manager-to-manager communication improvements to SNMP. SNMPv2 was introduced with RFC 1441, Introduction to version 2 of the Internet-standard Network Management Framework, but members of the IETF subcommittee could not agree on several sections of the SNMPv2 specification (primarily the protocol’s security and administrative needs). Several attempts to achieve acceptance of SNMPv2 have been made by releasing experimental modified versions, commonly known as SNMPv2*, SNMPv2, SNMPv2u, SNMPv1+, and SNMPv1.5, which do not contain the disputed parts.
SNMPv2 is a revised protocol that includes performance and manager-to-manager communication improvements to SNMP. SNMPv2 was introduced with RFC 1441, Introduction to version 2 of the Internet-standard Network Management Framework, but members of the IETF subcommittee could not agree on several sections of the SNMPv2 specification (primarily the protocol’s security and administrative needs). Several attempts to achieve acceptance of SNMPv2 have been made by releasing experimental modified versions, commonly known as SNMPv2*, SNMPv2, SNMPv2u, SNMPv1+, and SNMPv1.5, which do not contain the disputed parts.
![]() Community-based SNMPv2 (or SNMPv2c), which is defined in RFC 1901, Introduction to Community-based SNMPv2, is referred to as SNMPv2 because it is the most common implementation. The “c” stands for community-based security because SNMPv2c uses the same community strings as SNMPv1 for read and write access. SNMPv2 changes include the introduction of the following two new message types:
Community-based SNMPv2 (or SNMPv2c), which is defined in RFC 1901, Introduction to Community-based SNMPv2, is referred to as SNMPv2 because it is the most common implementation. The “c” stands for community-based security because SNMPv2c uses the same community strings as SNMPv1 for read and write access. SNMPv2 changes include the introduction of the following two new message types:
-
 GetBulk message type: Used for retrieving large amounts of data, such as tables. This message reduces repetitive requests and replies, thereby improving performance.
 -
 InformRequest: Used to alert the SNMP manager of a specific condition. Unlike unacknowledged trap messages, InformRequest messages are acknowledged. A managed device sends an InformRequest to the NMS; the NMS acknowledges the receipt of the message by sending a Response message back to the managed device.
![]() Another improvement of SNMPv2 over SNMPv1 is the addition of new data types with 64-bit counters because 32-bit counters were quickly overflowed by fast network interfaces.
Another improvement of SNMPv2 over SNMPv1 is the addition of new data types with 64-bit counters because 32-bit counters were quickly overflowed by fast network interfaces.
![]() On Cisco routers, Cisco IOS software release 11.3 and later versions implement SNMPv2. However, neither SNMPv1 nor SNMPv2 offers security features. Specifically, SNMPv1 and SNMPv2 can neither authenticate the source of a management message nor encrypt the message. Because of the lack of security features, many SNMPv1 and SNMPv2 implementations are limited to a read-only capability, reducing their usefulness to that of a network monitor.
On Cisco routers, Cisco IOS software release 11.3 and later versions implement SNMPv2. However, neither SNMPv1 nor SNMPv2 offers security features. Specifically, SNMPv1 and SNMPv2 can neither authenticate the source of a management message nor encrypt the message. Because of the lack of security features, many SNMPv1 and SNMPv2 implementations are limited to a read-only capability, reducing their usefulness to that of a network monitor.
SNMPv3
![]() SNMPv3 is the latest SNMP version to become a full standard. Its introduction has moved SNMPv1 and SNMPv2 to historic status. SNMPv3, which is described in RFCs 3410 through 3415, adds methods to ensure the secure transmission of critical data to and from managed devices. Table 3-2 lists these RFCs. Note that these RFCs make RFCs 2271 through 2275 and RFCs 2570 through 2575 obsolete.
SNMPv3 is the latest SNMP version to become a full standard. Its introduction has moved SNMPv1 and SNMPv2 to historic status. SNMPv3, which is described in RFCs 3410 through 3415, adds methods to ensure the secure transmission of critical data to and from managed devices. Table 3-2 lists these RFCs. Note that these RFCs make RFCs 2271 through 2275 and RFCs 2570 through 2575 obsolete.
|
|
|
|---|---|
|
|
|
|
|
|
|
|
|
|
|
|
|
|
|
|
|
|
![]() SNMPv3 introduces the following three security levels:
SNMPv3 introduces the following three security levels:
-
 NoAuthNoPriv: Without authentication and without privacy (encryption).
 -
 AuthNoPriv: With authentication but without privacy. Authentication is based on Hash-Based Message Authentication Code-Message Digest 5 or HMAC-Secure Hash Algorithm algorithms.
 -
 AuthPriv: With authentication as described earlier and privacy using the 56-bit Cipher-Block Chaining-Data Encryption Standard encryption standard.
![]() Security levels can be specified per user or per group of users via direct interaction with the managed device or via SNMP operations. Security levels determine which SNMP objects a user can access for reading, writing, or creating, and the list of notifications that users can receive. On Cisco routers, Cisco IOS software release 12.0 and later versions implement SNMPv3.
Security levels can be specified per user or per group of users via direct interaction with the managed device or via SNMP operations. Security levels determine which SNMP objects a user can access for reading, writing, or creating, and the list of notifications that users can receive. On Cisco routers, Cisco IOS software release 12.0 and later versions implement SNMPv3.
 MIB
MIB
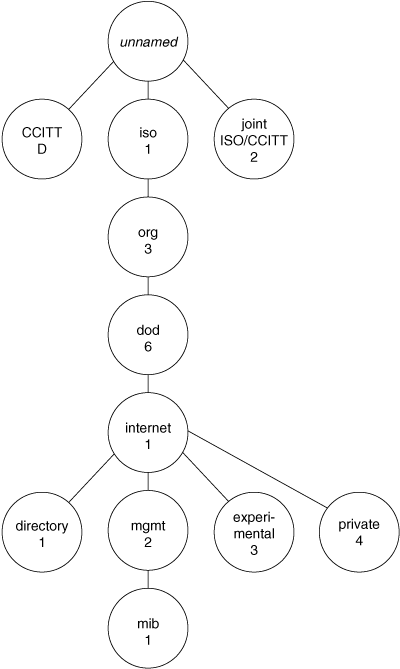
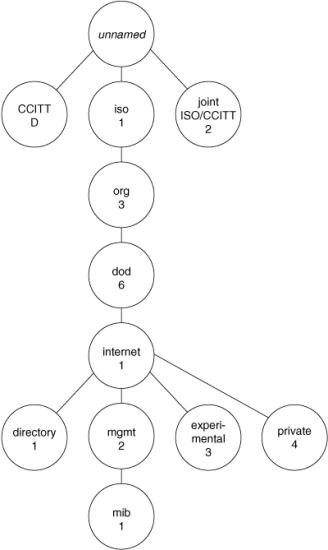
![]() Each object in a MIB has a unique identifier that network management applications use to identify and retrieve the value of the specific object. The MIB has a tree-like structure in which similar objects are grouped under the same branch of the MIB tree. For example, different interface counters are grouped under the MIB tree’s interfaces branch.
Each object in a MIB has a unique identifier that network management applications use to identify and retrieve the value of the specific object. The MIB has a tree-like structure in which similar objects are grouped under the same branch of the MIB tree. For example, different interface counters are grouped under the MIB tree’s interfaces branch.
![]() Standard MIBs are defined in various RFCs. For example, RFC 1213, Management Information Base for Network Management of TCP/IP-based internets: MIB-II, defines the TCP/IP MIB.
Standard MIBs are defined in various RFCs. For example, RFC 1213, Management Information Base for Network Management of TCP/IP-based internets: MIB-II, defines the TCP/IP MIB.
![]() In addition to standard MIBs, vendors can obtain their own branch of the MIB subtree and create custom managed objects under that branch. A Cisco router MIB uses both standard and private managed objects.
In addition to standard MIBs, vendors can obtain their own branch of the MIB subtree and create custom managed objects under that branch. A Cisco router MIB uses both standard and private managed objects.
![]() A Cisco router’s MIB tree contains several defined standard managed objects, including from the following groups:
A Cisco router’s MIB tree contains several defined standard managed objects, including from the following groups:
-
 Interface group (including interface description, type, physical address, counts of incoming and outgoing packets, and so forth)
 -
 IP group (including whether the device is acting as an IP gateway, the number of input packets, the number of packets discarded because of error, and so forth)
 -
 ICMP group (including the number of ICMP messages received, the number of messages with errors, and so forth)
![]() The Cisco private section of the MIB tree contains private managed objects, which were introduced by Cisco, such as the following objects for routers:
The Cisco private section of the MIB tree contains private managed objects, which were introduced by Cisco, such as the following objects for routers:
-
 Small, medium, large, and huge buffers
 -
 Primary and secondary memory
 -
 Proprietary protocols
![]() Private definitions of managed objects must be compiled into the NMS before they can be used; the result is output that is more descriptive, with variables and events that can be referred to by name.
Private definitions of managed objects must be compiled into the NMS before they can be used; the result is output that is more descriptive, with variables and events that can be referred to by name.
MIB-II
![]() MIB-II is an extension of the original MIB (which is now called MIB-I) and is defined by RFC 1213. MIB-II supports a number of new protocols and provides more detailed, structured information. It remains compatible with the previous version, which is why MIB-II retains the same object identifier as MIB-I (1.3.6.1.2.1).
MIB-II is an extension of the original MIB (which is now called MIB-I) and is defined by RFC 1213. MIB-II supports a number of new protocols and provides more detailed, structured information. It remains compatible with the previous version, which is why MIB-II retains the same object identifier as MIB-I (1.3.6.1.2.1).
![]() The location of MIB-II objects is under the iso.org.dod.internet.mgmt subtree, where the top-level MIB objects are defined as follows (definitions of these objects can be found in RFC 1213):
The location of MIB-II objects is under the iso.org.dod.internet.mgmt subtree, where the top-level MIB objects are defined as follows (definitions of these objects can be found in RFC 1213):
-
 System (1)
 -
 Interfaces (2)
 -
 Address Translation (3)
 -
 IP (4)
 -
 TCP (6)
 -
 UDP (7)
 -
 EGP (8)
 -
 Transmission (10)
 -
 SNMP (11)
![]() Although the MIB-II definition is an improvement over MIB-I, the following unresolved issues exist:
Although the MIB-II definition is an improvement over MIB-I, the following unresolved issues exist:
-
 MIB-II is still a device-centric solution, meaning that its focus is on individual devices, not the entire network or data flows.
 -
 MIB-II is poll-based, meaning that data is stored in managed devices and a management system must request (poll) it via the management protocol; the data is not sent automatically.
Cisco MIB
![]() The Cisco private MIB definitions are under the Cisco MIB subtree (1.3.6.1.4.1.9 or iso.org.dod.internet.private.enterprise.cisco). Cisco MIB definitions supported on Cisco devices are available at http://www.cisco.com/public/mibs/.
The Cisco private MIB definitions are under the Cisco MIB subtree (1.3.6.1.4.1.9 or iso.org.dod.internet.private.enterprise.cisco). Cisco MIB definitions supported on Cisco devices are available at http://www.cisco.com/public/mibs/.
![]() The Cisco private MIB subtree contains three subtrees: Local (2), Temporary (3), and CiscoMgmt (9). The Local (2) subtree contains MIB objects defined before Cisco IOS software release 10.2; these MIB objects are implemented in the SNMPv1 Structure of Management Information (SMI). The SMI defines the structure of data that resides within MIB-managed objects. Beginning with Cisco IOS software release 10.2, however, Cisco MIBs are defined according to the SNMPv2 SMI and are placed in the CiscoMgmt subtree (9). The variables in the temporary subtree are subject to change for each Cisco IOS software release.
The Cisco private MIB subtree contains three subtrees: Local (2), Temporary (3), and CiscoMgmt (9). The Local (2) subtree contains MIB objects defined before Cisco IOS software release 10.2; these MIB objects are implemented in the SNMPv1 Structure of Management Information (SMI). The SMI defines the structure of data that resides within MIB-managed objects. Beginning with Cisco IOS software release 10.2, however, Cisco MIBs are defined according to the SNMPv2 SMI and are placed in the CiscoMgmt subtree (9). The variables in the temporary subtree are subject to change for each Cisco IOS software release.
MIB Polling Guidelines
![]() Monitoring networks using SNMP requires that the NMS poll each managed device on a periodic basis to determine its status. Frequently polling many devices or MIB variables on a device across a network to a central NMS might result in performance issues, including congestion on slower links or at the NMS connection, or overwhelming the NMS resources when processing all the collected data. The following are recommended polling guidelines:
Monitoring networks using SNMP requires that the NMS poll each managed device on a periodic basis to determine its status. Frequently polling many devices or MIB variables on a device across a network to a central NMS might result in performance issues, including congestion on slower links or at the NMS connection, or overwhelming the NMS resources when processing all the collected data. The following are recommended polling guidelines:
-
 Restrict polling to only those MIB variables necessary for analysis.
 -
 Analyze and use the data collected; do not collect data if it is not analyzed.
 -
 Increase polling intervals (in other words, reduce the number of polls per period) over low-bandwidth links.
 -
 For larger networks, consider deploying management domains, a distributed model for deploying an NMS. Management domains permit polling to be more local to the managed devices. As a result, they reduce overall management traffic across the network and the potential for one failed device or link to interrupt management visibility to the remaining network. Aggregated management data might still be centralized when management domains are used. This model is particularly appropriate for networks that already have separate administrative domains or where large campuses or portions of the network are separated by slower WAN links.
 -
 Leverage nonpolling mechanisms such as SNMP traps, RMON, and syslog (as described in later sections of this chapter).
MIB Example
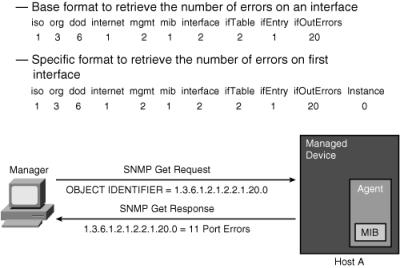
![]() Figure 3-29 depicts SNMP MIB variable retrieval in action.
Figure 3-29 depicts SNMP MIB variable retrieval in action.
![]() In this example, the network manager wants to retrieve the number of errors on the first interface. Starting with interface number 0, the valid range for interface numbers is 0 through the maximum number of ports minus one. The manager creates the SNMP Get Request message with reference to the MIB variable 1.3.6.1.2.1.2.2.1.20.0, which represents interface outgoing errors on interface 0. The agent creates the SNMP Get Response message in response to the manager’s request. The response includes the value of the referenced variable. In the example, the agent returned value is 11, indicating that there were 11 outgoing errors on that interface.
In this example, the network manager wants to retrieve the number of errors on the first interface. Starting with interface number 0, the valid range for interface numbers is 0 through the maximum number of ports minus one. The manager creates the SNMP Get Request message with reference to the MIB variable 1.3.6.1.2.1.2.2.1.20.0, which represents interface outgoing errors on interface 0. The agent creates the SNMP Get Response message in response to the manager’s request. The response includes the value of the referenced variable. In the example, the agent returned value is 11, indicating that there were 11 outgoing errors on that interface.
 RMON
RMON
![]() The RMON standard allows packet and traffic patterns on LAN segments to be monitored. RMON tracks the following items:
The RMON standard allows packet and traffic patterns on LAN segments to be monitored. RMON tracks the following items:
-
 Number of packets
 -
 Packet sizes
 -
 Broadcasts
 -
 Network utilization
 -
 Errors and conditions, such as Ethernet collisions
 -
 Statistics for hosts, including errors generated by hosts, busiest hosts, and which hosts communicate with each other
![]() RMON features include historical views of RMON statistics based on user-defined sample intervals, alarms that are based on user-defined thresholds, and packet capture based on user-defined filters.
RMON features include historical views of RMON statistics based on user-defined sample intervals, alarms that are based on user-defined thresholds, and packet capture based on user-defined filters.
| Note |
|
![]() RMON agents can reside in routers, switches, hubs, servers, hosts, or dedicated RMON probes. Because RMON can collect a lot of data, dedicated RMON probes are often used on routers and switches instead of enabling RMON agents on these devices. Performance thresholds can be set and reported on if the threshold is breached; this helps reduce management traffic. RMON provides effective network fault diagnosis, performance tuning, and planning for network upgrades.
RMON agents can reside in routers, switches, hubs, servers, hosts, or dedicated RMON probes. Because RMON can collect a lot of data, dedicated RMON probes are often used on routers and switches instead of enabling RMON agents on these devices. Performance thresholds can be set and reported on if the threshold is breached; this helps reduce management traffic. RMON provides effective network fault diagnosis, performance tuning, and planning for network upgrades.
RMON1
![]() Because RMON agents must look at every frame on the network, they might cause performance problems on a managed device. The agent’s performance can be classified based on processing power and memory.
Because RMON agents must look at every frame on the network, they might cause performance problems on a managed device. The agent’s performance can be classified based on processing power and memory.
| Note |
|
RMON1 Groups
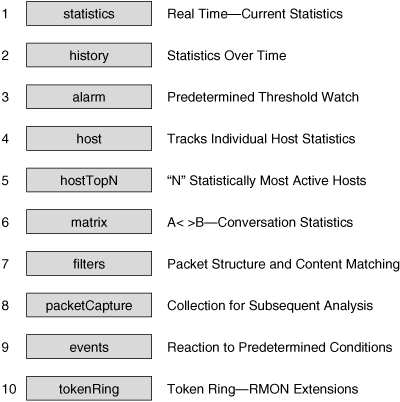
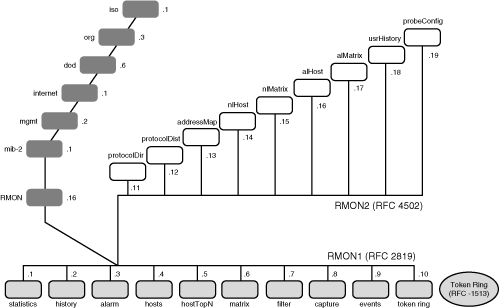
![]() RMON agents gather nine groups of statistics, ten including Token Ring, which are forwarded to a manager on request, usually via SNMP. As summarized in Figure 3-30, RMON1 agents can implement some or all of the following groups:
RMON agents gather nine groups of statistics, ten including Token Ring, which are forwarded to a manager on request, usually via SNMP. As summarized in Figure 3-30, RMON1 agents can implement some or all of the following groups:
-
 Statistics: Contains statistics such as packets sent, bytes sent, broadcast packets, multicast packets, CRC errors, runts, giants, fragments, jabbers, collisions, and so forth, for each monitored interface on the device.
 -
 History: Used to store periodic statistical samples for later retrieval.
 -
 Alarm: Used to set specific thresholds for managed objects and to trigger an event on crossing the threshold (this requires an Events group).
 -
 Host: Contains statistics associated with each host discovered on the network.
 -
 Host Top N: Contains statistics for hosts that top a list ordered by one of their observed variables.
 -
 Matrix: Contains statistics for conversations between sets of two addresses, including the number of packets or bytes exchanged between two hosts.
 -
 Filters: Contains rules for data packet filters; data packets matched by these rules generate events or are stored locally in a Packet Capture group.
 -
 Packet Capture: Contains data packets that match rules set in the Filters group.
 -
 Events: Controls the generation and notification of events from this device.
 -
 TokenRing: Contains the following Token Ring Extensions:
-
 Ring Station—Detailed statistics on individual stations
 -
 Ring Station Order—Ordered list of stations currently on the ring
 -
 Ring Station Configuration—Configuration information and insertion/removal data on each station
 -
 Source Routing—Statistics on source routing, such as hop counts
-
RMON1 and RMON2
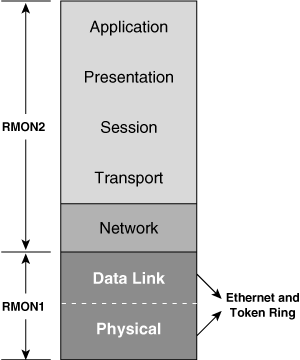
![]() RMON1 only provides visibility into the data link and the physical layers; potential problems that occur at the higher layers still require other capture and decode tools. Because of RMON1’s limitations, RMON2 was developed to extend functionality to upper-layer protocols. As illustrated in Figure 3-31, RMON2 provides full network visibility from the network layer through to the application layer.
RMON1 only provides visibility into the data link and the physical layers; potential problems that occur at the higher layers still require other capture and decode tools. Because of RMON1’s limitations, RMON2 was developed to extend functionality to upper-layer protocols. As illustrated in Figure 3-31, RMON2 provides full network visibility from the network layer through to the application layer.
![]() With visibility into the upper-layer protocols, the network manager can monitor any upper-layer protocol traffic for any device or subnet in addition to the MAC layer traffic.
With visibility into the upper-layer protocols, the network manager can monitor any upper-layer protocol traffic for any device or subnet in addition to the MAC layer traffic.
![]() RMON2 allows the collection of statistics beyond a specific segment’s MAC layer and provides an end-to-end view of network conversations per protocol. The network manager can view conversations at the network and application layers. Therefore, traffic generated by a specific host or even a specific application (for example, a Telnet client or a web browser) on that host can be observed.
RMON2 allows the collection of statistics beyond a specific segment’s MAC layer and provides an end-to-end view of network conversations per protocol. The network manager can view conversations at the network and application layers. Therefore, traffic generated by a specific host or even a specific application (for example, a Telnet client or a web browser) on that host can be observed.
RMON2 Groups
![]() Figure 3-32 illustrates the RMON groups that were added when RMON2 was introduced. They include the following:
Figure 3-32 illustrates the RMON groups that were added when RMON2 was introduced. They include the following:
-
 Protocol Directory: Provides the list of protocols that the device supports
 -
 Protocol Distribution: Contains traffic statistics for each supported protocol
 -
 Address Mapping: Contains network layer-to-MAC layer address mappings
 -
 Network Layer Host: Contains statistics for the network layer traffic to or from each host
 -
 Network Layer Matrix: Contains network layer traffic statistics for conversations between pairs of hosts
 -
 Application Layer Host: Contains statistics for the application layer traffic to or from each host
 -
 Application Layer Matrix: Contains application layer traffic statistics for conversations between pairs of hosts
 -
 User History Collection: Contains periodic samples of user-specified variables
 -
 Probe Configuration: Provides a standard way of remotely configuring probe parameters, such as trap destination and out-of-band management
| Note |
|
 NetFlow
![]() Cisco NetFlow is a measurement technology that measures flows that pass through Cisco devices.
Cisco NetFlow is a measurement technology that measures flows that pass through Cisco devices.
| Note |
|
![]() NetFlow answers the questions of what, when, where, and how traffic is flowing in the network. NetFlow data can be exported to network management applications to further process the information, providing tables and graphs for accounting and billing or as an aid for network planning. The key components of NetFlow are the NetFlow cache or data source that stores IP flow information and the NetFlow export or transport mechanism that sends NetFlow data to a network management collector, such as the NetFlow Collection Engine.
NetFlow answers the questions of what, when, where, and how traffic is flowing in the network. NetFlow data can be exported to network management applications to further process the information, providing tables and graphs for accounting and billing or as an aid for network planning. The key components of NetFlow are the NetFlow cache or data source that stores IP flow information and the NetFlow export or transport mechanism that sends NetFlow data to a network management collector, such as the NetFlow Collection Engine.
![]() NetFlow-collected data serves as the basis for a set of applications, including network traffic accounting, usage-based network billing, network planning, and network monitoring. NetFlow also provides the measurement base for QoS applications: It captures the traffic classification (or precedence) associated with each flow, thereby enabling differentiated charging based on QoS.
NetFlow-collected data serves as the basis for a set of applications, including network traffic accounting, usage-based network billing, network planning, and network monitoring. NetFlow also provides the measurement base for QoS applications: It captures the traffic classification (or precedence) associated with each flow, thereby enabling differentiated charging based on QoS.
![]() Non-NetFlow–enabled switching handles incoming packets independently, with separate serial tasks for switching, security services (access control lists [ACL]), and traffic measurements that are applied to each packet. Processing is applied only to a flow’s first packet with NetFlow-enabled switching; information from the first packet is used to build an entry in the NetFlow cache. Subsequent packets in the flow are handled via a single, streamlined task that handles switching, security services, and data collection concurrently. Multilayer switches support multilayer NetFlow.
Non-NetFlow–enabled switching handles incoming packets independently, with separate serial tasks for switching, security services (access control lists [ACL]), and traffic measurements that are applied to each packet. Processing is applied only to a flow’s first packet with NetFlow-enabled switching; information from the first packet is used to build an entry in the NetFlow cache. Subsequent packets in the flow are handled via a single, streamlined task that handles switching, security services, and data collection concurrently. Multilayer switches support multilayer NetFlow.
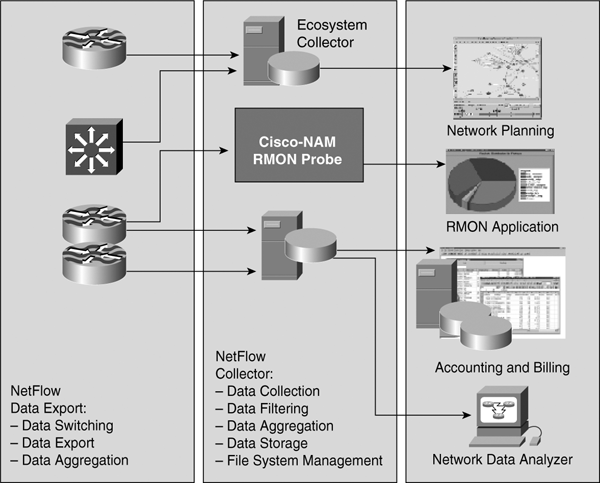
![]() Therefore, NetFlow services capitalize on the network traffic’s flow nature to provide detailed data collection with minimal impact on router performance and to efficiently process ACLs for packet filtering and security services. Figure 3-33 illustrates the NetFlow infrastructure.
Therefore, NetFlow services capitalize on the network traffic’s flow nature to provide detailed data collection with minimal impact on router performance and to efficiently process ACLs for packet filtering and security services. Figure 3-33 illustrates the NetFlow infrastructure.
![]() NetFlow can be configured to export data to a flow collector, a device that provides NetFlow export data filtering and aggregation capabilities, such as the NetFlow Collection Engine. Expired flows are grouped into NetFlow Export datagrams for export from the NetFlow-enabled device.
NetFlow can be configured to export data to a flow collector, a device that provides NetFlow export data filtering and aggregation capabilities, such as the NetFlow Collection Engine. Expired flows are grouped into NetFlow Export datagrams for export from the NetFlow-enabled device.
![]() The focus of NetFlow used to be on IP flow information; this is changing with the Cisco implementation of a generic export transport format. NetFlow version 9 (v9) export format is a flexible and extensible export format that is now on the IETF standards track in the IP Flow Information Export (IPFIX) working group. IPFIX export is a new generic data transport capability within Cisco routers. It can be used to transport performance information from a router or switch, including Layer 2 information, security detection and identification information, IP version 6 (IPv6), multicast, MPLS, and Border Gateway Protocol (BGP) information, and so forth. NetFlow enables several key customer applications, including the following:
The focus of NetFlow used to be on IP flow information; this is changing with the Cisco implementation of a generic export transport format. NetFlow version 9 (v9) export format is a flexible and extensible export format that is now on the IETF standards track in the IP Flow Information Export (IPFIX) working group. IPFIX export is a new generic data transport capability within Cisco routers. It can be used to transport performance information from a router or switch, including Layer 2 information, security detection and identification information, IP version 6 (IPv6), multicast, MPLS, and Border Gateway Protocol (BGP) information, and so forth. NetFlow enables several key customer applications, including the following:
-
 Accounting and billing: Because flow data includes details such as IP addresses, packet and byte counts, time stamps, and application port numbers, NetFlow data provides fine-grained metering for highly flexible and detailed resource utilization accounting. For example, service providers can use this information to migrate from single-fee, flat-rate billing to more flexible charging mechanisms based on time of day, bandwidth usage, application usage, QoS, and so forth. Enterprise customers can use the information for departmental cost recovery or cost allocation for resource utilization.
 -
 Network planning and analysis: NetFlow data provides key information for sophisticated network architecture tools to optimize both strategic planning (such as whom to peer with, backbone upgrade planning, and routing policy planning) and tactical network engineering decisions (such as adding resources to routers or upgrading link capacity). This has the benefit of minimizing the total cost of network operations while maximizing network performance, capacity, and reliability.
 -
 Network monitoring: NetFlow data enables extensive near-real-time network monitoring. To provide aggregate traffic- or application-based views, flow-based analysis techniques can be used to visualize the traffic patterns associated with individual routers and switches on a networkwide basis. This analysis provides network managers with proactive problem detection, efficient troubleshooting, and rapid problem resolution.
 -
 Application monitoring and profiling: NetFlow data enables network managers to gain a detailed, time-based view of application usage over the network. Content and service providers can use this information to plan and allocate network and application resources (such as web server sizing and location) to meet customer demands.
 -
 User monitoring and profiling: NetFlow data enables network managers to understand customer and user network utilization and resource application. This information can be used to plan efficiently; allocate access, backbone, and application resources; and detect and resolve potential security and policy violations.
 -
 NetFlow data warehousing and data mining: In support of proactive marketing and customer service programs, NetFlow data or the information derived from it can be warehoused for later retrieval and analysis. For example, you can determine which applications and services are being used by internal and external users and target them for improved service. This is especially useful for service providers, because NetFlow data enables them to create a wider range of offered services. For example, a service provider can easily determine the traffic characteristics of various services and, based on this data, provide new services to the users. An example of such a service is VoIP, which requires QoS adjustment; the service provider might charge users for this service.
NetFlow Versus RMON Information Gathering
![]() NetFlow can be configured on individual interfaces, thereby providing information on traffic that passes through those interfaces and collecting the following types of information:
NetFlow can be configured on individual interfaces, thereby providing information on traffic that passes through those interfaces and collecting the following types of information:
-
 Source and destination interfaces and IP addresses
 -
 TCP/UDP source port and destination ports
 -
 Number of bytes and packets in the flow
 -
 Source and destination autonomous system numbers (for BGP)
 -
 Time of day
 -
 IP ToS
![]() Compared to using SNMP with RMON MIB, NetFlow’s information-gathering benefits include greater detail of collected data, data time-stamping, support for various data per interface, and greater scalability to a large number of interfaces (RMON is also limited by the size of its memory table). NetFlow’s performance impact is much lower than RMON’s, and external probes are not required.
Compared to using SNMP with RMON MIB, NetFlow’s information-gathering benefits include greater detail of collected data, data time-stamping, support for various data per interface, and greater scalability to a large number of interfaces (RMON is also limited by the size of its memory table). NetFlow’s performance impact is much lower than RMON’s, and external probes are not required.
 CDP
CDP
![]() CDP is a media- and protocol-independent protocol that is enabled by default on each supported interface of Cisco devices (such as routers, access servers, and switches). The physical media must support Subnetwork Access Protocol encapsulation. Figure 3-34 illustrates the relationship between CDP and other protocols.
CDP is a media- and protocol-independent protocol that is enabled by default on each supported interface of Cisco devices (such as routers, access servers, and switches). The physical media must support Subnetwork Access Protocol encapsulation. Figure 3-34 illustrates the relationship between CDP and other protocols.

CDP Information
![]() Information in CDP frames includes the following:
Information in CDP frames includes the following:
-
 Device ID: The name of the neighbor device and either the MAC address or the serial number of the device.
 -
 Local Interface: The local (on this device) interface connected to the discovered neighbor.
 -
 Holdtime: The remaining amount of time (in seconds) that the local device holds the CDP advertisement from a sending device before discarding it.
 -
 Capability List: The type of device discovered (R—Router, T—Trans Bridge, B—Source Route Bridge, S—Switch, H—Host, I—IGMP, r—Repeater).
 -
 Platform: The device’s product type.
 -
 Port Identifier (ID): The port (interface) number on the discovered neighbor on which the advertisement is sent. This is the interface on the neighbor device to which the local device is connected.
 -
 Address List: All network layer protocol addresses configured on the interface (or, in the case of protocols configured globally, on the device). Examples include IP, Internetwork Packet Exchange, and DECnet.
How CDP Works
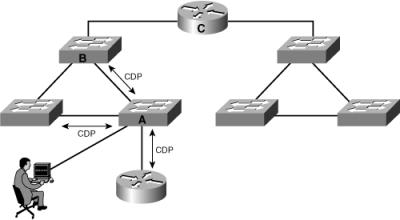
![]() As illustrated in Figure 3-35, CDP information is sent only between directly connected Cisco devices. In this figure, the person connected to Switch A can see the router and the two switches directly attached to Switch A; other devices are not visible via CDP. For example, the person would have to log in to Switch B to see Router C with CDP.
As illustrated in Figure 3-35, CDP information is sent only between directly connected Cisco devices. In this figure, the person connected to Switch A can see the router and the two switches directly attached to Switch A; other devices are not visible via CDP. For example, the person would have to log in to Switch B to see Router C with CDP.
![]() CDP is a hello-based protocol, and all Cisco devices that run CDP periodically advertise their attributes to their neighbors using a multicast address. These frames advertise a time-to-live value (the holdtime, in seconds) that indicates how long the information must be retained before it can be discarded. CDP frames are sent with a time-to-live value that is nonzero after an interface is enabled. A time-to-live value of 0 is sent immediately before an interface is shut down, allowing other devices to quickly discover lost neighbors.
CDP is a hello-based protocol, and all Cisco devices that run CDP periodically advertise their attributes to their neighbors using a multicast address. These frames advertise a time-to-live value (the holdtime, in seconds) that indicates how long the information must be retained before it can be discarded. CDP frames are sent with a time-to-live value that is nonzero after an interface is enabled. A time-to-live value of 0 is sent immediately before an interface is shut down, allowing other devices to quickly discover lost neighbors.
![]() Cisco devices receive CDP frames and cache the received information; it is then available to be sent to the NMS via SNMP. If any information changes from the last received frame, the new information is cached and the previous information is discarded, even if its time-to-live value has not yet expired.
Cisco devices receive CDP frames and cache the received information; it is then available to be sent to the NMS via SNMP. If any information changes from the last received frame, the new information is cached and the previous information is discarded, even if its time-to-live value has not yet expired.
![]() CDP is on by default and operates on any operational interface. However, CDP can be disabled on an interface or globally on a device. Consequently, some caveats are indicated:
CDP is on by default and operates on any operational interface. However, CDP can be disabled on an interface or globally on a device. Consequently, some caveats are indicated:
-
 Do not run CDP on links that you do not want discovered, such as Internet connections.
 -
 Do not run CDP on links that do not go to Cisco devices.
![]() For security reasons, block SNMP access to CDP data (or any other data) from outside your network and from subnets other than the management station subnet.
For security reasons, block SNMP access to CDP data (or any other data) from outside your network and from subnets other than the management station subnet.
 Syslog Accounting
![]() A system message and error reporting service is an essential component of any operating system. The syslog system message service provides a means for the system and its running processes to report system state information to a network manager.
A system message and error reporting service is an essential component of any operating system. The syslog system message service provides a means for the system and its running processes to report system state information to a network manager.
![]() Cisco devices produce syslog messages as a result of network events. Every syslog message contains a time stamp (if enabled), severity level, and facility.
Cisco devices produce syslog messages as a result of network events. Every syslog message contains a time stamp (if enabled), severity level, and facility.
![]() Example 3-1 shows samples of syslog messages produced by the Cisco IOS software. The most common messages are those that a device produces upon exiting configuration mode, and the link up and down messages. If ACL logging is configured, the device generates syslog messages when packets match the ACL condition. ACL logging can be useful to detect packets that are denied access based on the security policy that is set by an ACL.
Example 3-1 shows samples of syslog messages produced by the Cisco IOS software. The most common messages are those that a device produces upon exiting configuration mode, and the link up and down messages. If ACL logging is configured, the device generates syslog messages when packets match the ACL condition. ACL logging can be useful to detect packets that are denied access based on the security policy that is set by an ACL.
20:11:31: %SYS-5- CONFIG I: Configured from console by console

20:11:57: %LINK-5-CHANGED: Interface FastEthernet0/0, changed state to administratively down
20:11:58: %LINEPROTO-5-UPDOWN: Line protocol on Interface FastEthernet0/0, changed state to down

20:12:04: %LINK-3-UPDOWN: Interface FastEthernet0/0, changed state to up
20:12:06: %LINEPROTO-5-UPDOWN: Line protocol on Interface FastEthernet0/0, changed state to up
20:13:53: %SEC-6-IPACCESSLOGP: list internet-inbound denied udp 66.56.16.77(1029) -
> 63.78.199.4(161), 1 packet
20:14:26: %MLS-5-MLSENABLED:IP Multilayer switching is enabled
20:14:26: %MLS-5-NDEDISABLED: Netflow Data Export disabled
20:14:26: %SYS-5-MOD_OK:Module 1 is online
20:15:47: %SYS-5-MOD_OK:Module 3 is online
20:15:42: %SYS-5-MOD_OK:Module 6 is online
20:16:27: %PAGP-5-PORTTOSTP:Port 3/1 joined bridge port 3/1
20:16:28: %PAGP-5-PORTTOSTP:Port 3/2 joined bridge port 3/2
![]() Syslog messages contain up to 80 characters; a percent sign (%) follows the optional sequence number or time-stamp information if configured. Syslog messages are structured as follows:
Syslog messages contain up to 80 characters; a percent sign (%) follows the optional sequence number or time-stamp information if configured. Syslog messages are structured as follows:
seq no:timestamp: %facility-severity-MNEMONIC:description
![]() The following parameters are used in the syslog messages:
The following parameters are used in the syslog messages:
-
 A sequence number appears on the syslog message if the service sequence-numbers global configuration command is configured.
 -
 The time stamp shows the date and time of the message or event if the service timestamps log [datetime | log] global configuration command is configured. The time stamp can have one of three formats:
-
 mm/dd hh:mm:ss
 -
 hh:mm:ss (for short uptimes)
 -
 d h (for long uptimes)
-
-
 Facility: A code consisting of two or more uppercase letters that indicate the facility to which the message refers. Syslog facilities are service identifiers used to identify and categorize system state data for error and event message reporting. A facility can be a hardware device, a protocol, or a module of the system software. The Cisco IOS software has more than 500 different facilities; the following are the most common:
-
 IP
IP -
 OSPF (OSPF protocol)
 -
 SYS (operating system)
 -
 IPsec (IP Security)
 -
 RSP (Route Switch Processor)
 -
 IF (interface)
 -
 LINK (data link messages)
 Other facilities include CDP, QoS, RADIUS, multicast (MCAST), MLS, TCP, VLAN trunking protocol (VTP), Telnet, and trivial file transfer protocol (TFTP).
-
-
 Severity: A single-digit code (from 0 to 7) that reflects the severity of the condition; the lower the number, the more serious the situation. Syslog defines the following severity levels:
-
 Emergency (Level 0, which is the highest level)
 -
 Alert (Level 1)
 -
 Critical (Level 2)
 -
 Error (Level 3)
 -
 Warning (Level 4)
 -
 Notice (Level 5)
 -
 Informational (Level 6)
 -
 Debugging (Level 7)
-
-
 Mnemonic: A code that uniquely identifies the error message.
 -
 Description: A text string that describes the condition. This portion of the message sometimes contains detailed information about the event, including port numbers, network addresses, or addresses that correspond to locations in the system memory address space.
| Note |
|
Syslog Distributed Architecture
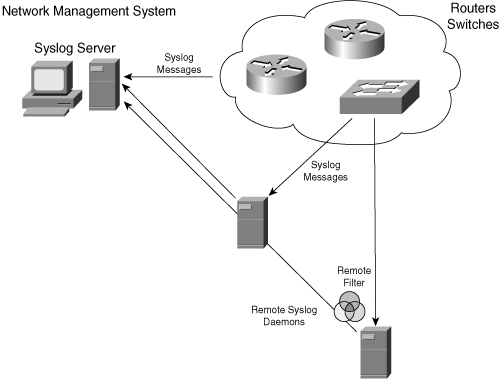
![]() Figure 3-36 illustrates the syslog distributed architecture.
Figure 3-36 illustrates the syslog distributed architecture.
![]() Syslog messages are sent to the console session by default. A device must be configured to send syslog messages elsewhere; the configuration includes the address of the NMS or another device. Network devices can be configured to send syslog messages directly to the NMS or to the remote network host on which a syslog analyzer is installed. A syslog analyzer conserves bandwidth on WAN links because the analyzer usually applies different filters and sends only the predefined subset of all syslog messages it receives. The analyzer filters and periodically forwards messages to the central NMS. For example, the analyzer could filter ACL logging data from other router or switch syslog entries to ensure that the ACL logging data does not overwhelm the syslog reporting tool.
Syslog messages are sent to the console session by default. A device must be configured to send syslog messages elsewhere; the configuration includes the address of the NMS or another device. Network devices can be configured to send syslog messages directly to the NMS or to the remote network host on which a syslog analyzer is installed. A syslog analyzer conserves bandwidth on WAN links because the analyzer usually applies different filters and sends only the predefined subset of all syslog messages it receives. The analyzer filters and periodically forwards messages to the central NMS. For example, the analyzer could filter ACL logging data from other router or switch syslog entries to ensure that the ACL logging data does not overwhelm the syslog reporting tool.
![]() The Syslog Analyzer is a CiscoWorks Resource Manager Essentials application that supports a distributed syslog server architecture for localized collection, filtering, aggregation, and forwarding of syslog data to a central syslog server for further processing and analysis. The Syslog Analyzer also supports reporting functions to automatically parse the log data into predefined or custom formats for ease of use and readability.
The Syslog Analyzer is a CiscoWorks Resource Manager Essentials application that supports a distributed syslog server architecture for localized collection, filtering, aggregation, and forwarding of syslog data to a central syslog server for further processing and analysis. The Syslog Analyzer also supports reporting functions to automatically parse the log data into predefined or custom formats for ease of use and readability.
![]() When it receives a syslog message, the NMS applies filters to remove unwanted messages. Filters can also be applied to perform actions based on the received syslog message, such as paging or e-mailing the network manager.
When it receives a syslog message, the NMS applies filters to remove unwanted messages. Filters can also be applied to perform actions based on the received syslog message, such as paging or e-mailing the network manager.
![]() Syslog data can consume large amounts of network bandwidth and might require a very large storage capacity based on the number of devices sending syslog messages, the syslog facility and severity levels set for each, and any error conditions that may trigger excessive log messages. Therefore, it is important to enable logging only for network facilities of particular interest and to set the appropriate severity level to provide sufficient, but not excessive, detail.
Syslog data can consume large amounts of network bandwidth and might require a very large storage capacity based on the number of devices sending syslog messages, the syslog facility and severity levels set for each, and any error conditions that may trigger excessive log messages. Therefore, it is important to enable logging only for network facilities of particular interest and to set the appropriate severity level to provide sufficient, but not excessive, detail.
![]() Selectively filter and aggregate syslog data that the distributed or centralized syslog servers receive based on the requirements.
Selectively filter and aggregate syslog data that the distributed or centralized syslog servers receive based on the requirements.
Summary
![]() In this chapter, you learned about modularizing the network, with a focus on the following topics:
In this chapter, you learned about modularizing the network, with a focus on the following topics:
-
 The hierarchical network model’s three layers: access, distribution, and core
 -
 The Cisco SONA framework that integrates the enterprise-wide network
 -
 The Cisco Enterprise Architecture functional areas:
-
 Enterprise Campus: Including the Campus Infrastructure module (composed of the Campus Core layer, the Building Distribution layer, and the Building Access layer) and the Server farm module
 -
 Enterprise Edge: Including the E-commerce module, the Internet Connectivity module, the Remote Access and VPN module, and the WAN and MAN and Site-to-Site VPN module
 -
 Service Provider: Including the Internet Service Provider module, the PSTN module, and the Frame Relay/ATM module
 -
 Enterprise Branch
 -
 Enterprise Data Center
 -
 Enterprise Teleworker
-
-
 The infrastructure services and application networking services used within the Cisco Enterprise Architecture modules
 -
 Security services to protect network resources and users from internal and external threats
 -
 High-availability services to ensure adequate connectivity for mission-critical applications
 -
 Voice services to support VoIP and IP telephony
 -
 Wireless services to support mobile clients connecting to the enterprise network
 -
 ANS to make the network aware of the content carried across it and to optimally handle that content
 -
 Network management protocols and features, including SNMP, MIBs, RMON, NetFlow, CDP, and syslog
References
![]() See the following resources for additional information:
See the following resources for additional information:
-
 “Service-Oriented Network Architecture: Introduction,” http://www.cisco.com/go/sona/
 -
 Top-Down Network Design, Second Edition, Priscilla Oppenheimer, Cisco Press, 2004
 -
 “Internetworking Design Basics,” Cisco Internetwork Design Guide, http://www.cisco.com/univercd/cc/td/doc/cisintwk/idg4/nd2002.htm
 -
 “SAFE Blueprint for Small, Midsize, and Remote-User Networks,” http://www.cisco.com/go/safe/
 -
 “Enterprise Architectures: Introduction,” http://www.cisco.com/en/US/netsol/ns517/networking_solutions_market_segment_solutions_home.html
 -
 NetFlow Services Solutions Guide, http://www.cisco.com/en/US/products/sw/netmgtsw/ps1964/products_implementation_design_guide09186a00800d6a11.html
Case Study: ACMC Hospital Modularity
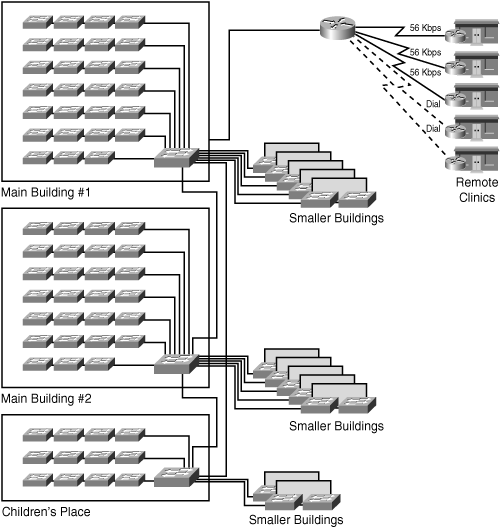
![]() This case study is a continuation of the ACMC Hospital case study introduced in Chapter 2.
This case study is a continuation of the ACMC Hospital case study introduced in Chapter 2.
![]() In this case study, you apply the Cisco Enterprise Architecture to the ACMC Hospital network requirements and develop a high-level view of the planned network hierarchy. Complete the following steps:
In this case study, you apply the Cisco Enterprise Architecture to the ACMC Hospital network requirements and develop a high-level view of the planned network hierarchy. Complete the following steps:
|
| |
|
| |
|
| |
|
| |
|
|








0 comments
Post a Comment