Characterizing the Existing Network and Sites
![]() The second step of the design methodology is characterizing the existing network and sites. Information collected and documented in this step is important, because the design might depend on the existing network’s hardware, software, and link capacity.
The second step of the design methodology is characterizing the existing network and sites. Information collected and documented in this step is important, because the design might depend on the existing network’s hardware, software, and link capacity.
![]() In many cases, a network already exists and the new design relies on restructuring and upgrading the existing network and sites. Even when a network does not exist, the sites that will be networked still should be examined. The following sections present insights into the process of examining an existing network and sites and describe the tools used to gather the data, assess the network, and analyze the network. A checklist to assess the network’s health is presented. Guidelines for creating a summary report are introduced. The discussion concludes with the draft design document and estimates of the time required to complete the entire characterization process.
In many cases, a network already exists and the new design relies on restructuring and upgrading the existing network and sites. Even when a network does not exist, the sites that will be networked still should be examined. The following sections present insights into the process of examining an existing network and sites and describe the tools used to gather the data, assess the network, and analyze the network. A checklist to assess the network’s health is presented. Guidelines for creating a summary report are introduced. The discussion concludes with the draft design document and estimates of the time required to complete the entire characterization process.
![]() The first step in characterizing the existing network and sites is to gather as much information about them as possible, typically based on the following input:
The first step in characterizing the existing network and sites is to gather as much information about them as possible, typically based on the following input:
|
|
|
|
|
|
|
|
|
| Note |
|
![]() The following sections describe each of these steps and the tools used.
The following sections describe each of these steps and the tools used.
 Customer Input
![]() Customer input includes all pertinent network and site documentation. Some items the designer could request, depending on the scope of the project, include the following:
Customer input includes all pertinent network and site documentation. Some items the designer could request, depending on the scope of the project, include the following:
-
 Site contact information (especially needed if remote deployments are planned)
 -
 Existing network infrastructure (from physical diagrams and documents, and site surveys as needed), including the following:
-
 Locations and types of servers, including a list of network applications supported
 -
 Locations and types of network devices
 -
 Cabling that is currently in place, including network interface connection tables and worksheets
 -
 Wiring closet locations
 -
 Environmental controls, including heating, ventilation, and air conditioning requirements, and filtration
 -
 Locations of telephone service demarcation points
 -
 WAN speeds and locations of the WAN connection feeds
 -
 Locations of power receptacles, and availability of additional receptacles and power sources
-
-
 Existing network infrastructure from logical topology diagrams, including the addressing scheme and routing protocols in use, and the infrastructure services supported, such as voice, storage, and wireless services
 -
 Information about the expected network functionality
![]() This documentation should allow the designer to determine information about the planned and existing network and sites, including the following:
This documentation should allow the designer to determine information about the planned and existing network and sites, including the following:
-
 Network topology: Includes devices, physical and logical links, external connections, bandwidth of connections, frame types (data link encapsulations), IP addressing, routing protocols, and so forth.
 -
 Network services: Includes security, QoS, high availability, voice, storage, wireless, and so forth.
 -
 Network applications: Examples include unified messaging and video delivery.
![]() All this information should be included in the design document; it also forms the basis for breaking the network into modules.
All this information should be included in the design document; it also forms the basis for breaking the network into modules.
Sample Site Contact Information
![]() Site contact information is especially important for projects involving remote deployments when equipment delivery and installations must be coordinated. The customer might provide all the necessary site contact information, or the designer might have to conduct a physical site audit to obtain the necessary information.
Site contact information is especially important for projects involving remote deployments when equipment delivery and installations must be coordinated. The customer might provide all the necessary site contact information, or the designer might have to conduct a physical site audit to obtain the necessary information.
![]() While at the site, the designer can also obtain other information; for example, power availability can be determined by examining the existing wiring closets. Digital pictures taken by a remote site contact can help in getting a quick sense of the remote environment. Table 2-8 illustrates a sample site contact form.
While at the site, the designer can also obtain other information; for example, power availability can be determined by examining the existing wiring closets. Digital pictures taken by a remote site contact can help in getting a quick sense of the remote environment. Table 2-8 illustrates a sample site contact form.
| |
| |
| |
|
|
|
|
|
|
| |
| |
|
|
|
|
|
|
Sample High-Level Network Diagram
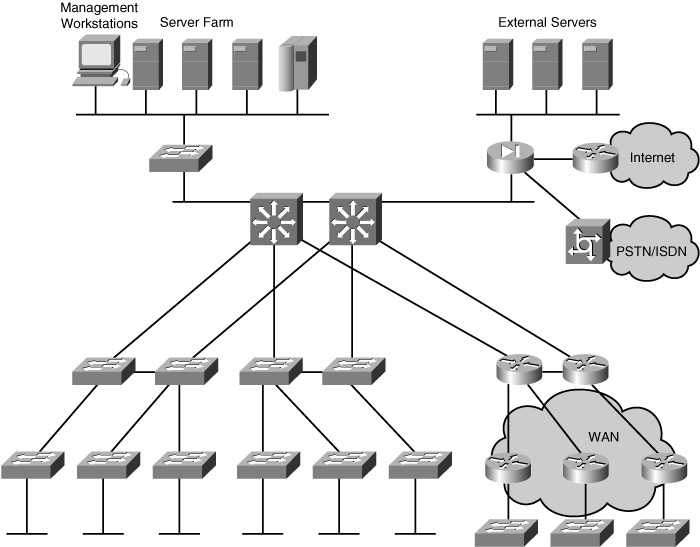
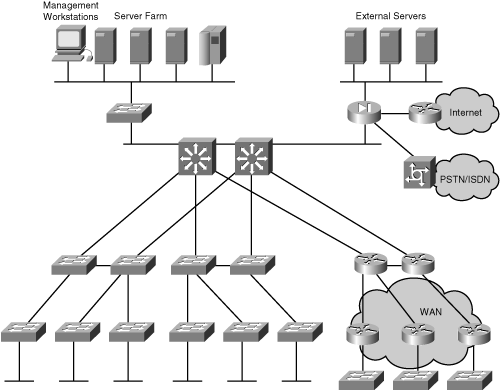
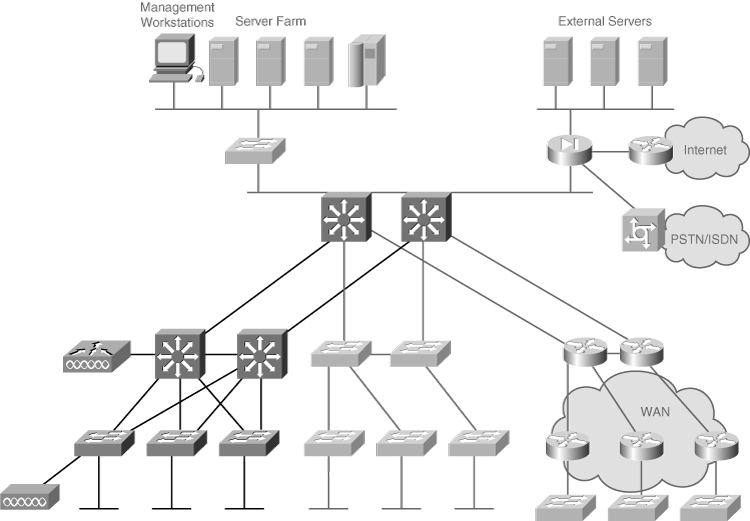
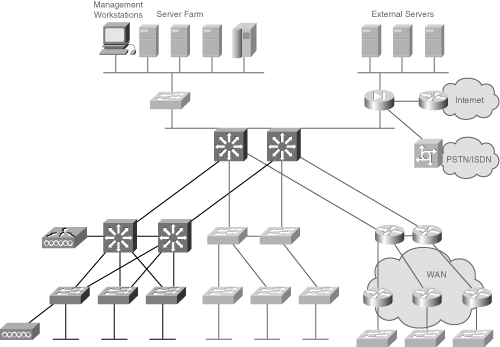
![]() Figure 2-8 shows the high-level topology of a sample network, provided by a customer.
Figure 2-8 shows the high-level topology of a sample network, provided by a customer.
![]() With only this diagram, many questions remain about the network and the expected network functionality, including the following:
With only this diagram, many questions remain about the network and the expected network functionality, including the following:
-
 What is the IP addressing scheme?
 -
 What level of redundancy or high availability currently exists in the network?
 -
 What level of redundancy or high availability is required in the new network?
 -
 What are the details of the security design?
 -
 What types of links are in the network?
 -
 What are the link speeds?
 -
 How is connectivity provided to remote sites?
 -
 What network infrastructure services are in use, such as voice and video, and what is planned?
 -
 Are existing wireless devices in place, or are any wireless deployments planned?
 -
 What routing protocols are in use?
 -
 Are there any server farm or remote data center connectivity requirements?
 -
 What network management tools are in place?
![]() It is important to get as much information as possible about the existing situation before commencing design.
It is important to get as much information as possible about the existing situation before commencing design.
 Auditing or Assessing the Existing Network
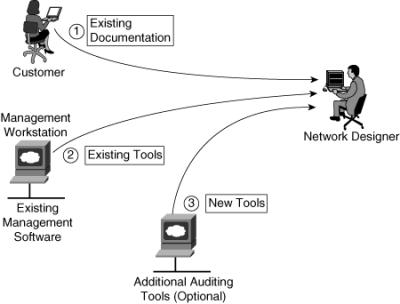
![]() A network audit or assessment is the second step in acquiring information about an existing network. The auditing process starts by consolidating existing information the customer provides. Up-to-date information can be gathered from the existing management software used by the customer. If the customer has insufficient tools, the designer can choose to temporarily introduce additional software tools; if they prove useful, these tools can be used in the network permanently (during the Operate and Optimize phases). An audit provides details such as the following:
A network audit or assessment is the second step in acquiring information about an existing network. The auditing process starts by consolidating existing information the customer provides. Up-to-date information can be gathered from the existing management software used by the customer. If the customer has insufficient tools, the designer can choose to temporarily introduce additional software tools; if they prove useful, these tools can be used in the network permanently (during the Operate and Optimize phases). An audit provides details such as the following:
-
 A list of network devices
 -
 Hardware specifications and versions, and software versions of network devices
 -
 Configurations of network devices
 -
 Output of various auditing tools to verify and augment the existing documentation
 -
 Link, CPU, and memory utilization of network devices
 -
 A list of unused ports, modules, and slots in network devices, to be used to understand whether the network is expandable
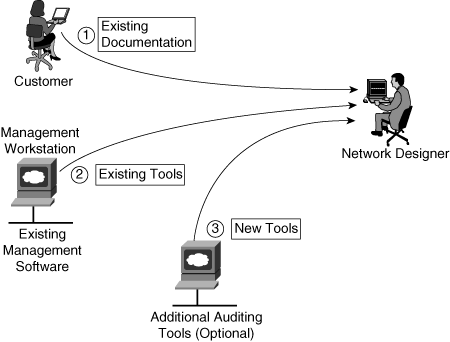
![]() Figure 2-9 illustrates three different sources of information that can be used in the auditing process: existing documentation, existing tools, and new tools.
Figure 2-9 illustrates three different sources of information that can be used in the auditing process: existing documentation, existing tools, and new tools.
![]() The auditing process might require minor (temporary) network changes. Automated auditing should be used in large networks for which a manual approach would take too much time. However, the audit process balances both detail and effort to produce as much information as needed or possible. For example, it should not require that a large set of CPU-heavy auditing tools be purchased and installed in the customer network to collect configurations of network devices. The auditing process is typically performed from a central location, such as a location in a secure environment that has access to all network devices.
The auditing process might require minor (temporary) network changes. Automated auditing should be used in large networks for which a manual approach would take too much time. However, the audit process balances both detail and effort to produce as much information as needed or possible. For example, it should not require that a large set of CPU-heavy auditing tools be purchased and installed in the customer network to collect configurations of network devices. The auditing process is typically performed from a central location, such as a location in a secure environment that has access to all network devices.
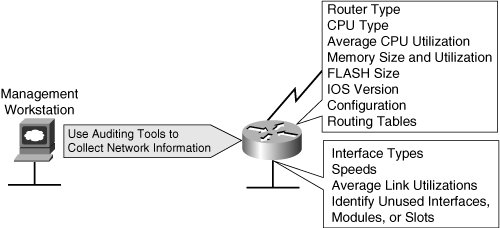
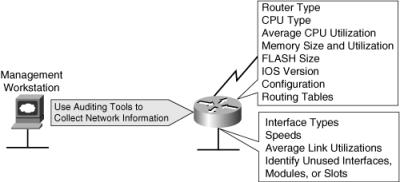
![]() Figure 2-10 illustrates sample information that a manual or automated auditing process collects from the network management workstation. The auditing process should collect all information relevant to the redesign. The same process should be used for all network devices affected by the design.
Figure 2-10 illustrates sample information that a manual or automated auditing process collects from the network management workstation. The auditing process should collect all information relevant to the redesign. The same process should be used for all network devices affected by the design.
 Tools for Assessing the Network
![]() A small network can be assessed without special tools. Monitoring commands can be used to collect relevant information on a small number of network devices. The approach can be semiautomated by introducing scripting tools to execute the monitoring commands automatically.
A small network can be assessed without special tools. Monitoring commands can be used to collect relevant information on a small number of network devices. The approach can be semiautomated by introducing scripting tools to execute the monitoring commands automatically.
![]() In large networks, a manual auditing approach is too time-consuming and less reliable. The following are some special tools that can be used to collect the relevant information from the network devices:
In large networks, a manual auditing approach is too time-consuming and less reliable. The following are some special tools that can be used to collect the relevant information from the network devices:
-
 CiscoWorks to map a network and collect various types of information (such as network topology, hardware and software versions, configurations, and so on).
 -
 Third-party tools such as WhatsUp Professional from Ipswitch, SNMPc from Castle Rock Computing, open-source Cacti (which is a successor to the popular Multi Router Traffic Grapher), NetMRI from Netcordia, and NetVoyant from NetQoS.
 -
 Other vendors’ tools to collect relevant information from equipment manufactured by those vendors.
 -
 Other tools can help characterize the existing environment. For example, instead of a full wireless site survey, it can be helpful to conduct a brief RF sample of the environment using enterprise-level tools. Such tools include AirMagnet Survey PRO (to perform an RF site survey), Cognio Spectrum Expert (a spectrum analysis tool), and laptop applications such as AiroPeek from WildPackets (network analyzer software that supports decoding of wireless data packets) and the Cisco Aironet Site Survey Utility. Wireless networks are described in detail in Chapter 9, “Wireless Network Design Considerations.”
Manual Information Collection Examples
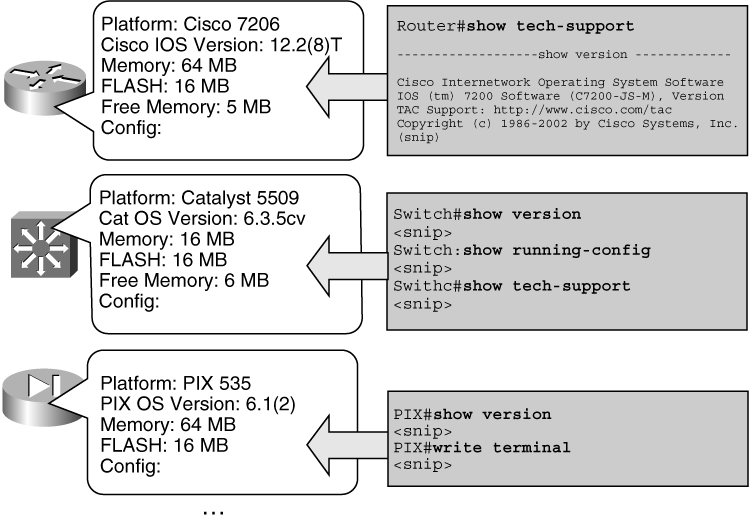
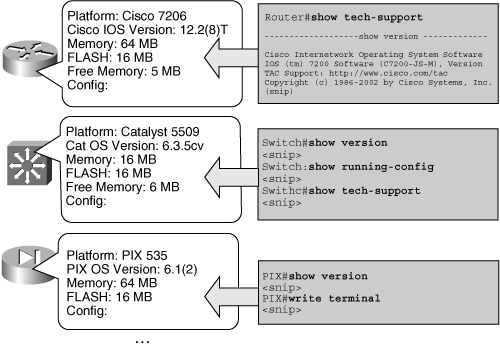
![]() The auditing process can be performed manually on relatively small networks using various monitoring commands. Figure 2-11 illustrates three different types of network devices, information to be collected, and commands that can be used to obtain the information:
The auditing process can be performed manually on relatively small networks using various monitoring commands. Figure 2-11 illustrates three different types of network devices, information to be collected, and commands that can be used to obtain the information:
-
 On Cisco routers that run Cisco IOS software, the show tech-support command usually displays all information about the router. show processes cpu can be used to determine CPU use, and show processes memory can be used to determine memory usage.
 -
 On Cisco switches that run Cisco Catalyst Operating System (CatOS) software, the most useful commands vary, depending on the version of the software. Useful commands might include show version, show running-config, or show tech-support, if available.
 -
 On Cisco Secure PIX Security Appliances, the show version and write terminal (to see the configuration) commands are useful.
![]() Many other commands are available on Cisco devices to determine relevant information.
Many other commands are available on Cisco devices to determine relevant information.
| Note |
|
![]() Example 2-1 illustrates sample output from the show processes cpu command on a Cisco router.
Example 2-1 illustrates sample output from the show processes cpu command on a Cisco router.
Router#show processes cpu


CPU utilization for five seconds: 24%/20%; one minute: 45%; five minutes: 40%
PID Runtime(ms)   Invoked      uSecs    5Sec    1Min    5Min  TTY  Process
  1        2464    468381          5   0.00%   0.00%   0.00%    0  Load Meter
  2          44        44       1000   0.16%   0.04%   0.01%   66  Virtual Exec
  3           0         2          0   0.00%   0.00%   0.00%    0  IpSecMibTopN
  4     6326689    513354      12324   0.00%   0.25%   0.27%    0  Check heaps
  5           0         1          0   0.00%   0.00%   0.00%    0  Chunk Manager
  6          60        58       1034   0.00%   0.00%   0.00%    0  Pool Manager
  7           0         2          0   0.00%   0.00%   0.00%    0  Timers
  8           0        12          0   0.00%   0.00%   0.00%    0  Serial Backgroun
  9        2139    468342          4   0.00%   0.00%   0.00%    0  ALARM_TRIGGER_SC
 10        3851     78081         49   0.00%   0.00%   0.00%    0  Environmental mo
 11        4768     44092        108   0.00%   0.00%   0.00%    0  ARP Input
 12        4408     19865        221   0.00%   0.00%   0.00%    0  DDR Timers
 13           4         2       2000   0.00%   0.00%   0.00%    0  Dialer event
 14          16         2       8000   0.00%   0.00%   0.00%    0  Entity MIB API
 15           0         1          0   0.00%   0.00%   0.00%    0  SERIAL A'detect
 16           0         1          0   0.00%   0.00%   0.00%    0  Critical Bkgnd
 17       57284    377088        151   0.00%   0.00%   0.00%    0  Net Background
 18       15916     59331        268   0.00%   0.00%   0.00%    0  Logger
![]() The output in Example 2-1 displays information about the network device CPU utilization, which is important for describing the network’s health. Table 2-9 describes the show processes cpu command output’s fields and descriptions.
The output in Example 2-1 displays information about the network device CPU utilization, which is important for describing the network’s health. Table 2-9 describes the show processes cpu command output’s fields and descriptions.
|
| |
|---|---|
|
|
|
|
|
|
|
|
|
|
|
|
|
|
|
|
|
|
|
|
|
|
|
|
|
|
|
|
|
|
![]() Example 2-2 illustrates sample output from the show processes memory command on a Cisco router.
Example 2-2 illustrates sample output from the show processes memory command on a Cisco router.
Router#show process memory
Total: 26859400, Used: 8974380, Free: 17885020
PID TTY  Allocated      Freed    Holding    Getbufs    Retbufs Process
  0   0      88464       1848    6169940          0          0 *Init*
  0   0        428    1987364        428          0          0 *Sched*
  0   0  116119836  105508736     487908     373944      55296 *Dead*
  1   0        284        284       3868          0          0 Load Meter
  2  66       5340       1080      17128          0          0 Virtual Exec
  3   0        668        284       7252          0          0 IpSecMibTopN
  4   0          0          0       6868          0          0 Check heaps
  5   0         96          0       6964          0          0 Chunk Manager
  6   0      17420     231276       6964       5388     254912 Pool Manager
  7   0        284        284       6868          0          0 Timers
  8   0        284        284       6868          0          0 Serial Background
  9   0          0          0       6868          0          0 ALARM_TRIGGER_SC
 10   0        284        284       6868          0          0 Environmental mo
 11   0        316    3799360       7184          0          0 ARP Input
 12   0    2547784    1033916       7372       6804          0 DDR Timers
 13   0        284        284      12868          0          0 Dialer event
 14   0      10744       2284      15328          0          0 Entity MIB API
 15   0         96          0       6964          0          0 SERIAL A'detect
 16   0         96          0       6964          0          0 Critical Bkgnd
 17   0      23412       2632      15404          0          0 Net Background
![]() Table 2-10 describes the show processes memory command output's fields and descriptions.
Table 2-10 describes the show processes memory command output's fields and descriptions.
|
|
|
|---|---|
|
|
|
|
|
|
|
|
|
|
|
|
|
|
|
|
|
|
|
|
|
|
|
|
|
|
|
|
|
|
|
|
|
|
|
|
Automatic Information Collection Examples
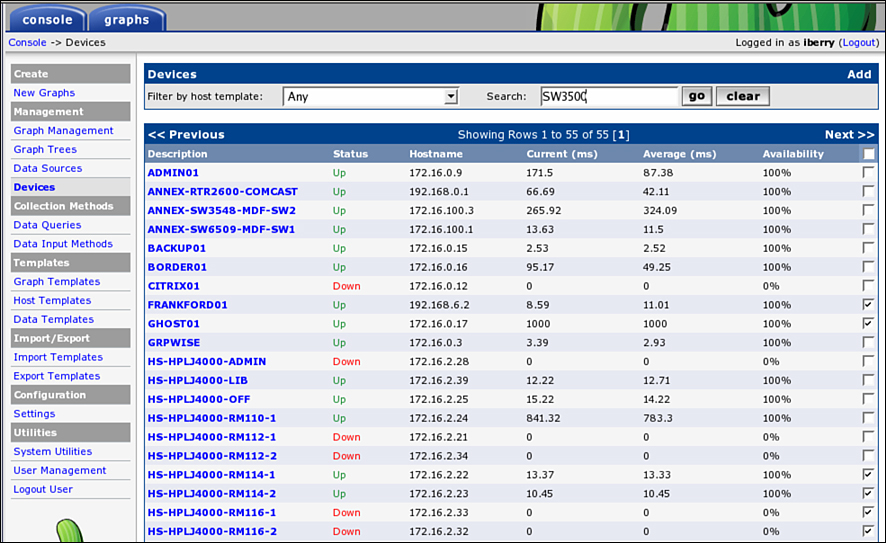
![]() Figure 2-12 is a screen shot from the open-source Cacti application showing a list of devices found in the network.
Figure 2-12 is a screen shot from the open-source Cacti application showing a list of devices found in the network.
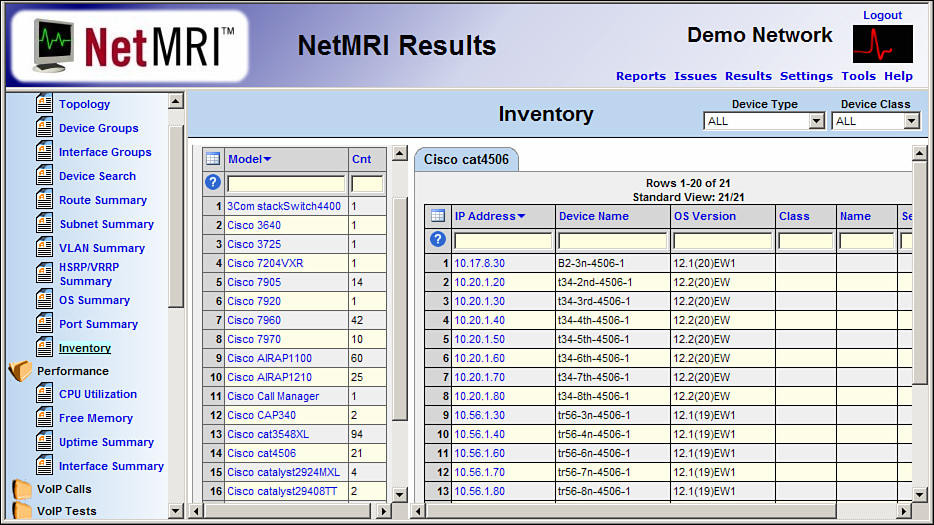
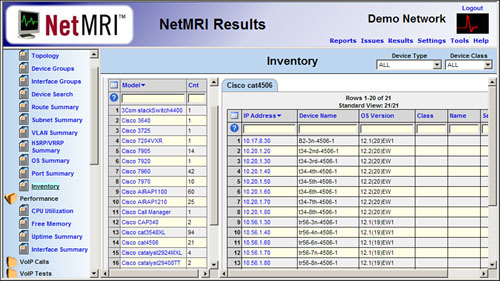
![]() Figure 2-13 is a screen shot from the NetMRI appliance from Netcordia. The inventory results are expanded to show the Cisco Cat4506 devices, including IP addresses, device names, and operating system versions.
Figure 2-13 is a screen shot from the NetMRI appliance from Netcordia. The inventory results are expanded to show the Cisco Cat4506 devices, including IP addresses, device names, and operating system versions.
 Analyzing Network Traffic and Applications
![]() Traffic analysis is the third step in characterizing a network. Traffic analysis verifies the set of applications and protocols used in the network and determines the applications’ traffic patterns. It might reveal any additional applications or protocols running on the network. Each discovered application and protocol should be described in the following terms:
Traffic analysis is the third step in characterizing a network. Traffic analysis verifies the set of applications and protocols used in the network and determines the applications’ traffic patterns. It might reveal any additional applications or protocols running on the network. Each discovered application and protocol should be described in the following terms:
-
 Importance to the customer
 -
 QoS-related requirements
 -
 Security-related requirements
 -
 Scope (in other words, the network modules in which the application or protocol is used)
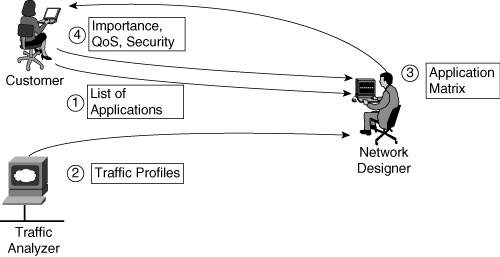
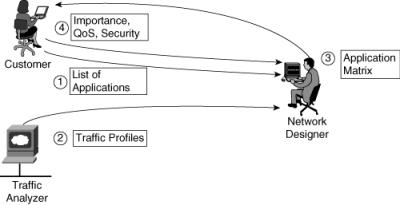
![]() Use the following interactive approach, illustrated in Figure 2-14, to create a list of applications and protocols used in the network:
Use the following interactive approach, illustrated in Figure 2-14, to create a list of applications and protocols used in the network:
|
|
|
|
|
|
|
|
|
|
|
|
![]() For example, the following information was collected about a fictitious application:
For example, the following information was collected about a fictitious application:
-
 Name: Application #8
 -
 Description: Accounting software
 -
 Protocol: Transmission Control Protocol (TCP) port 5151
 -
 Servers: 2
 -
 Clients: 50
 -
 Scope: Campus
 -
 Importance: High
 -
 Avg. Rate: 50 kbps with 10-second bursts to 1 megabit per second (Mbps)
![]() Assume that a customer requirement concerns QoS on a WAN connection with limited bandwidth. In this case, the information collected is relevant because it describes the following:
Assume that a customer requirement concerns QoS on a WAN connection with limited bandwidth. In this case, the information collected is relevant because it describes the following:
-
 The application (TCP port 5151), which is required for performing classification
 -
 The importance of the application; this information is useful for evaluating how much bandwidth should be allocated to the application
 -
 The current bandwidth consumption according to the present QoS implementation
![]() Note, however, that this information might not be relevant should the customer requirement instead concern a secure and resilient Internet connection. In that case, it might be necessary to gather additional information.
Note, however, that this information might not be relevant should the customer requirement instead concern a secure and resilient Internet connection. In that case, it might be necessary to gather additional information.
 Tools for Analyzing Traffic
![]() Tools used for traffic analysis range from manual identification of applications using Cisco IOS software commands to those in which dedicated software- or hardware-based analyzers capture live packets or use the Simple Network Management Protocol (SNMP) to gather interface information. Analysis tools include the following:
Tools used for traffic analysis range from manual identification of applications using Cisco IOS software commands to those in which dedicated software- or hardware-based analyzers capture live packets or use the Simple Network Management Protocol (SNMP) to gather interface information. Analysis tools include the following:
-
 Cisco IOS Network-Based Application Recognition (NBAR): NBAR can be used to identify the presence of well-known applications and protocols in the network.
 -
 Cisco IOS NetFlow technology: NetFlow is an integral part of Cisco IOS software that collects and measures data as it enters specific routers or switch interfaces. NetFlow allows the identification of lesser-known applications because it gathers information about every flow. This information can be collected manually using the Cisco IOS software show ip cache [verbose] flow command. Alternatively, Cisco Network Service (CNS) NetFlow Collection Engine (NFC) allows automatic information gathering of each flow in the network segment.
 -
 Third-party hardware or software-based products: Can be used to analyze traffic in different subnets of the network. Examples include the following:
-
 The open-source Cacti (http://www.cacti.net/)
 -
 Network General Sniffer (http://www.sniffer.com/)
 -
 WildPackets EtherPeek and AiroPeek (http://www.wildpackets.com/)
 -
 SolarWinds Orion (http://www.solarwindssoftware.com/)
 -
 Wireshark (http://www.wireshark.org/)
-
-
 Remote monitoring probes can also be used to support traffic analysis.
![]() The following sections include examples of some of these tools.
The following sections include examples of some of these tools.
NBAR
![]() Cisco IOS NBAR is a classification engine that recognizes a wide variety of applications, including web-based and other difficult-to-classify protocols, which utilize dynamic TCP and User Datagram Protocol (UDP) port assignments. Other QoS tools within the network can be configured to invoke services for a specific application that is recognized and classified by NBAR, ensuring that network resources are used efficiently.
Cisco IOS NBAR is a classification engine that recognizes a wide variety of applications, including web-based and other difficult-to-classify protocols, which utilize dynamic TCP and User Datagram Protocol (UDP) port assignments. Other QoS tools within the network can be configured to invoke services for a specific application that is recognized and classified by NBAR, ensuring that network resources are used efficiently.
![]() Example 2-3 is sample output of the Cisco IOS NBAR show ip nbar protocol-discovery command. This command shows the statistics gathered by the NBAR Protocol Discovery feature, which provides an easy way to discover application protocols that are transiting an interface. The Protocol Discovery feature discovers any protocol traffic supported by NBAR and can be used to monitor both input and output traffic. This command displays statistics for all interfaces on which the Protocol Discovery feature is currently enabled. The default output of this command includes the average 30-second bit rate (in bits per second), input byte count, input packet count, and protocol name.
Example 2-3 is sample output of the Cisco IOS NBAR show ip nbar protocol-discovery command. This command shows the statistics gathered by the NBAR Protocol Discovery feature, which provides an easy way to discover application protocols that are transiting an interface. The Protocol Discovery feature discovers any protocol traffic supported by NBAR and can be used to monitor both input and output traffic. This command displays statistics for all interfaces on which the Protocol Discovery feature is currently enabled. The default output of this command includes the average 30-second bit rate (in bits per second), input byte count, input packet count, and protocol name.
Router#show ip nbar protocol-discovery
FastEthernet0/0.2
                          Input                    Output
 Protocol                 Packet Count             Packet Count
                          Byte Count               Byte Count
                          30 second bit rate (bps) 30 second bit rate(bps)
 ------------------------ ------------------------ -----------------------
 http                     46384                    79364
                          5073520                  64042528
                          305                      1655

 secure-http              2762                     2886
                          429195                   1486350
                          0                        0
 snmp                     143                      10676
                          17573                    1679322
                          0                        0
 telnet                   1272                     12147
                          122284                   988834
                          0                        0
 ntp                      5383                     0
                          624428                   0
                          0                        0
 dns                      305                      235
                          31573                    55690
                          50                       120
NetFlow
![]() NetFlow switching provides network administrators with access to detailed recording information from their data networks. NetFlow also provides a highly efficient mechanism with which to process security access lists without paying as much of a performance penalty as other available switching methods incur.
NetFlow switching provides network administrators with access to detailed recording information from their data networks. NetFlow also provides a highly efficient mechanism with which to process security access lists without paying as much of a performance penalty as other available switching methods incur.
![]() Cisco Network Service NetFlow Collection technology provides the base for applications, including network traffic accounting, usage-based network billing, network planning, network monitoring, outbound marketing, and data-mining capabilities for both service provider and enterprise customers. Cisco provides a set of NFC applications that collect NetFlow export data, perform data volume reduction and post-processing, and give end-user applications easy access to NFC data. NFC also provides measurement-based QoS by capturing the traffic classification or precedence associated with each flow, enabling differentiated charging based on QoS. NFC is supported on HPUX, Solaris, Linux, and the Cisco CNS Programmable Network Family product. Chapter 3, “Structuring and Modularizing the Network,” discusses NetFlow technology in more detail.
Cisco Network Service NetFlow Collection technology provides the base for applications, including network traffic accounting, usage-based network billing, network planning, network monitoring, outbound marketing, and data-mining capabilities for both service provider and enterprise customers. Cisco provides a set of NFC applications that collect NetFlow export data, perform data volume reduction and post-processing, and give end-user applications easy access to NFC data. NFC also provides measurement-based QoS by capturing the traffic classification or precedence associated with each flow, enabling differentiated charging based on QoS. NFC is supported on HPUX, Solaris, Linux, and the Cisco CNS Programmable Network Family product. Chapter 3, “Structuring and Modularizing the Network,” discusses NetFlow technology in more detail.
![]() Example 2-4 provides sample output from the Cisco IOS show ip cache flow command, illustrating statistics gathered by the NetFlow switching feature. By analyzing NetFlow data, a designer can identify the cause of congestion, determine the class of service for each user and application, and identify the traffic’s source and destination network. NetFlow allows extremely granular and accurate traffic measurements and high-level aggregated traffic collection.
Example 2-4 provides sample output from the Cisco IOS show ip cache flow command, illustrating statistics gathered by the NetFlow switching feature. By analyzing NetFlow data, a designer can identify the cause of congestion, determine the class of service for each user and application, and identify the traffic’s source and destination network. NetFlow allows extremely granular and accurate traffic measurements and high-level aggregated traffic collection.
Router#show ip cache flow


IP packet size distribution (12718M total packets):
  1-32   64   96  128  160  192  224  256  288  320  352  384  416  448  480
  .000 .554 .042 .017 .015 .009 .009 .009 .013 .030 .006 .007 .005 .004 .004

   512  544  576 1024 1536 2048 2560 3072 3584 4096 4608
  .003 .007 .139 .019 .098 .000 .000 .000 .000 .000 .000


IP Flow Switching Cache, 4456448 bytes
 65509 active, 27 inactive, 820628747 added
 955454490 ager polls, 0 flow alloc failures
 Exporting flows to 1.1.15.1 (2057)
 820563238 flows exported in 34485239 udp datagrams, 0 failed
 last clearing of statistics 00:00:03


Protocol         Total  Flows   Packets Bytes  Packets Active(Sec) Idle(Sec)
--------         Flows   /Sec     /Flow  /Pkt     /Sec     /Flow     /Flow
TCP-Telnet     2656855    4.3        86    78    372.3      49.6      27.6
TCP-FTP        5900082    9.5         9    71     86.8      11.4      33.1
TCP-FTPD       3200453    5.1       193   461   1006.3      45.8      33.4
TCP-WWW      546778274  887.3        12   325  11170.8       8.0      32.3
TCP-SMTP      25536863   41.4        21   283    876.5      10.9      31.3
TCP-BGP          24520    0.0        28   216      1.1      26.2      39.0
TCP-other     49148540   79.7        47   338   3752.6      30.7      32.2
UDP-DNS      117240379  190.2         3   112    570.8       7.5      34.7
UDP-NTP        9378269   15.2         1    76     16.2       2.2      38.7
UDP-TFTP          8077    0.0         3    62      0.0       9.7      33.2
UDP-Frag         51161    0.0        14   322      1.2      11.0      39.4
ICMP          14837957   24.0         5   224    125.8      12.1      34.3
IP-other         77406    0.1        47   259      5.9      52.4      27.0
...
Total:       820563238 1331.7        15   304  20633.0       9.8      33.0
![]() Table 2-11 provides the show ip cache flow command output's fields and descriptions.
Table 2-11 provides the show ip cache flow command output's fields and descriptions.
|
|
|
|---|---|
|
|
|
|
|
|
|
|
|
|
|
|
|
|
|
|
|
|
|
|
|
|
|
|
|
|
|
|
|
|
|
| |
|
|
|
|
|
|
|
|
|
|
|
|
|
|
|
|
|
|
|
| |
|
|
|
Other Network Analysis Tools Examples
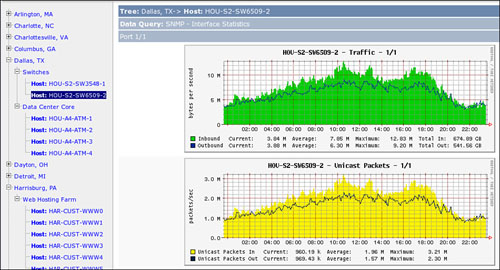
![]() Figure 2-15 shows sample output from the Cacti tool, illustrating the daily throughput on a link in Dallas.
Figure 2-15 shows sample output from the Cacti tool, illustrating the daily throughput on a link in Dallas.
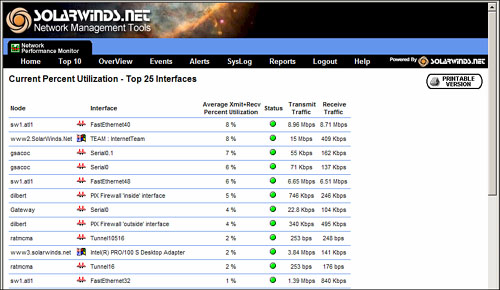
![]() Figure 2-16 is a sample utilization table from the SolarWinds Orion tool, illustrating the current percentage utilization on the top 25 interfaces.
Figure 2-16 is a sample utilization table from the SolarWinds Orion tool, illustrating the current percentage utilization on the top 25 interfaces.
 Network Health Checklist
![]() Based on the data gathered from the customer’s network, the designer should check off any items that are true in the following Network Health Checklist. On a healthy network, it should be possible to check off all the items.
Based on the data gathered from the customer’s network, the designer should check off any items that are true in the following Network Health Checklist. On a healthy network, it should be possible to check off all the items.
![]() Note that these guidelines are only approximations. Exact thresholds depend on the type of traffic, applications, internetworking devices, topology, and criteria for accepting network performance. As every good engineer knows, the answer to most network performance questions (and most questions in general) is “It depends.”
Note that these guidelines are only approximations. Exact thresholds depend on the type of traffic, applications, internetworking devices, topology, and criteria for accepting network performance. As every good engineer knows, the answer to most network performance questions (and most questions in general) is “It depends.”
-
 No shared Ethernet segments are saturated (no more than 40 percent network utilization).
 -
 No WAN links are saturated (no more than 70 percent network utilization).
 -
 The response time is generally less than 100 milliseconds (1 millisecond = 1/1000 of a second; 100 milliseconds = 1/10 of a second).
 -
 No segments have more than 20 percent broadcasts or multicasts.
 -
 No segments have more than one cyclic redundancy check error per million bytes of data.
 -
 On the Ethernet segments, less than 0.1 percent of the packets result in collisions.
 -
 The Cisco routers are not overutilized (the 5-minute CPU utilization is no more than 75 percent).
 -
 The number of output queue drops has not exceeded 100 in an hour on any Cisco router.
 -
 The number of input queue drops has not exceeded 50 in an hour on any Cisco router.
 -
 The number of buffer misses has not exceeded 25 in an hour on any Cisco router.
 -
 The number of ignored packets has not exceeded 10 in an hour on any interface on a Cisco router.
![]() The designer should also document any concerns about the existing network’s health and its ability to support growth.
The designer should also document any concerns about the existing network’s health and its ability to support growth.
 Summary Report
![]() The result of the network characterization process is a summary report that describes the network’s health. The customer input, network audit, and traffic analysis should provide enough information to identify possible problems in the existing network. The collected information must be collated into a concise summary report that identifies the following:
The result of the network characterization process is a summary report that describes the network’s health. The customer input, network audit, and traffic analysis should provide enough information to identify possible problems in the existing network. The collected information must be collated into a concise summary report that identifies the following:
-
 Features required in the network
 -
 Possible drawbacks of and problems in the existing network
 -
 Actions needed to support the new network’s requirements and features
![]() With this information, the designer should be able to propose hardware and software upgrades to support the customer requirements or to influence a change in requirements. Example 2-5 presents a sample summary report that identifies different aspects of a network infrastructure.
With this information, the designer should be able to propose hardware and software upgrades to support the customer requirements or to influence a change in requirements. Example 2-5 presents a sample summary report that identifies different aspects of a network infrastructure.
The network uses 895 routers:
–655 routers use Cisco IOS software version 12.3 or later
–221 routers use Cisco IOS software version 12.1(15)
–19 routers use Cisco IOS software version 12.0(25)

Requirement: QoS congestion management (queuing) required in the WAN
Identified problem:
–Cisco IOS software version 12.0 does not support new queuing technologies
–15 out of 19 routers with Cisco IOS software 12.0 are in the WAN
–12 out of 15 routers do not have enough memory to upgrade to Cisco IOS
software version 12.3 or later
–5 out of 15 routers do not have enough flash memory to upgrade to Cisco IOS
software version 12.3 or later

Recommended action:
–12 memory upgrades to 64 Megabytes (MB), 5 FLASH upgrades to 16MB
Alternatives:
–Replace hardware as well as software to support queuing
–Find an alternative mechanism for that part of the network
–Find an alternative mechanism and use it instead of queuing
–Evaluate the consequences of not implementing the required feature in that part of the network
![]() The summary report conclusions should identify the existing infrastructure’s shortcomings. In Example 2-5, QoS congestion management (queuing) is required. However, the designer has identified that Cisco IOS software version 12.0 does not support the newest queuing technologies. In addition, some routers do not have enough RAM and flash memory for an upgrade.
The summary report conclusions should identify the existing infrastructure’s shortcomings. In Example 2-5, QoS congestion management (queuing) is required. However, the designer has identified that Cisco IOS software version 12.0 does not support the newest queuing technologies. In addition, some routers do not have enough RAM and flash memory for an upgrade.
![]() Summary report recommendations relate the existing network and the customer requirements. These recommendations can be used to propose upgrading of hardware and software to support the required features or modifying the customer requirements. In this example, options include evaluating the necessity of the queuing requirement in the WAN.
Summary report recommendations relate the existing network and the customer requirements. These recommendations can be used to propose upgrading of hardware and software to support the required features or modifying the customer requirements. In this example, options include evaluating the necessity of the queuing requirement in the WAN.
 Creating a Draft Design Document
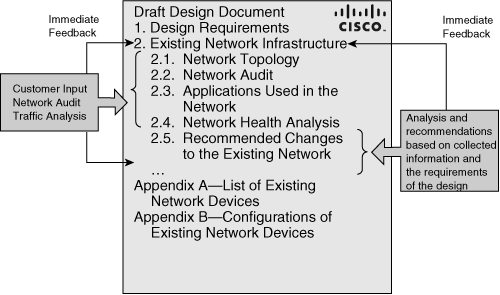
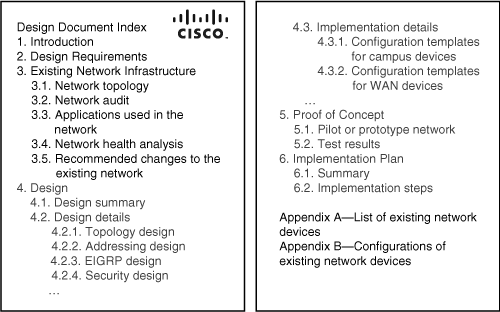
![]() After thoroughly examining the existing network, the designer creates a draft design document. Figure 2-17 illustrates a draft design document’s index (not yet fully developed), including the section that describes the existing network. The “Design Requirements” and “Existing Network Infrastructure” chapters of the design document are closely related—examining the existing network can result in changes to the design requirements. Data from both chapters directly influences the network’s design.
After thoroughly examining the existing network, the designer creates a draft design document. Figure 2-17 illustrates a draft design document’s index (not yet fully developed), including the section that describes the existing network. The “Design Requirements” and “Existing Network Infrastructure” chapters of the design document are closely related—examining the existing network can result in changes to the design requirements. Data from both chapters directly influences the network’s design.
![]() Typical draft documentation for an existing network should include the following items:
Typical draft documentation for an existing network should include the following items:
-
 Logical (Layer 3) topology map or maps. Divide the topology into network modules if the network is too large to fit into one topology map.
 -
 Physical (Layer 1) topology map or maps.
 -
 The network audit results, including the types of traffic in the network, the traffic congestion points, the suboptimal traffic paths, and so on.
 -
 A summary section describing the major network services used in the existing network, such as Open Shortest Path First (OSPF), Border Gateway Protocol (BGP), and Internet Protocol Security (IPsec).
 -
 A summary description of applications and overlay services used in the network.
 -
 A summary description of issues that might affect the design or the established design requirements.
 -
 A list of existing network devices, with the platform and software versions.
 -
 Configurations of existing network devices, usually attached as either a separate document or an appendix to the design document.
 Time Estimates for Performing Network Characterization
![]() This section provides some guidelines to estimate how long it may take to characterize the network. The time required to characterize a network varies significantly, depending on factors such as the following:
This section provides some guidelines to estimate how long it may take to characterize the network. The time required to characterize a network varies significantly, depending on factors such as the following:
-
 The experience of the network engineer
 -
 The quality of documentation provided by the customer and the quality of the communication with the customer
 -
 The size and complexity of network
 -
 The efficiency of network management and discovery tools
 -
 Whether or not the network devices are carefully managed via SNMP
 -
 How much information is needed for the scope of the project
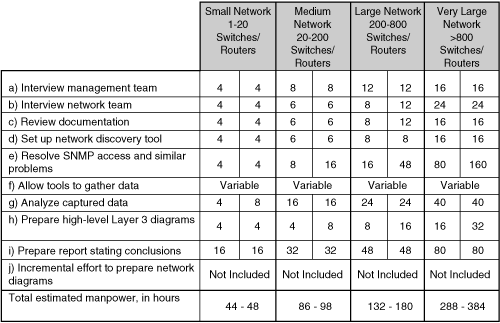
![]() Figure 2-18 provides a range of time estimates, in hours, for the characterization of networks in a variety of sizes. These estimates assume a highly skilled (Cisco Certified Internet Expert level) network engineer with efficient automated tools for network discovery and performance gathering, and a network in which the devices communicate with SNMP. The network characterization includes strategic evaluation and possible network redesign.
Figure 2-18 provides a range of time estimates, in hours, for the characterization of networks in a variety of sizes. These estimates assume a highly skilled (Cisco Certified Internet Expert level) network engineer with efficient automated tools for network discovery and performance gathering, and a network in which the devices communicate with SNMP. The network characterization includes strategic evaluation and possible network redesign.
![]() The steps in Figure 2-18 are as follows:
The steps in Figure 2-18 are as follows:
-
 Interviewing the management team to gather goals and constraints.
 -
 Interviewing the network team, and gathering goals, constraints, documentation, and diagrams.
 -
 Reviewing documentation and diagrams, and clarifying items with the site team.
 -
 Setting up the network discovery tool, which typically involves using automated discovery or entering a device list or IP address range into the tool; verifying that the tool has found most routers and switches; and starting to collect performance data.
 -
 Resolving SNMP access and similar problems if devices have not been very carefully managed in the past.
 -
 Allowing the discovery tool to gather data. The time for this step will vary depending on network, and should include seasonal or cyclical factors, but generally one week of data is sufficient. The network engineer typically does not need to oversee this process.
 -
 Analyzing the captured data; minimizing the time required is dependent on using efficient tools.
 -
 Preparing high-level (Layer 3) diagrams of the proposed network.
 -
 Preparing the report of conclusions and recommendations.
| Note |
|
![]() Consequently, network characterization typically takes from one to many weeks of effort, depending on the size and complexity of the network and the other factors mentioned at the beginning of this section.
Consequently, network characterization typically takes from one to many weeks of effort, depending on the size and complexity of the network and the other factors mentioned at the beginning of this section.
Using the Top-Down Approach to Network Design
![]() After establishing the organizational requirements and documenting the existing network, the designer is ready to design a network solution. This section first discusses the top-down approach to network design. Decision tables and structured design are described, and the section includes a brief discussion of the types of network design tools that might be used. The section concludes with a discussion about building a pilot or prototype, and the contents of a detailed design document.
After establishing the organizational requirements and documenting the existing network, the designer is ready to design a network solution. This section first discusses the top-down approach to network design. Decision tables and structured design are described, and the section includes a brief discussion of the types of network design tools that might be used. The section concludes with a discussion about building a pilot or prototype, and the contents of a detailed design document.
 The Top-Down Approach to Network Design
![]() Designing a large or even medium-sized network can be a complex project. Procedures have been developed to facilitate the design process by dividing it into smaller, more manageable steps. Identifying the separate steps or tasks ensures a smooth process and reduces potential risks.
Designing a large or even medium-sized network can be a complex project. Procedures have been developed to facilitate the design process by dividing it into smaller, more manageable steps. Identifying the separate steps or tasks ensures a smooth process and reduces potential risks.
![]() A top-down design allows the designer to “see the big picture” before getting to the details. Top-down design clarifies the design goals and initiates the design from the perspective of the required applications. The top-down approach adapts the physical infrastructure to the needs of the applications. Network devices are chosen only after a thorough requirements analysis. Structured design practices should be integrated with the top-down approach, especially in very complex networks.
A top-down design allows the designer to “see the big picture” before getting to the details. Top-down design clarifies the design goals and initiates the design from the perspective of the required applications. The top-down approach adapts the physical infrastructure to the needs of the applications. Network devices are chosen only after a thorough requirements analysis. Structured design practices should be integrated with the top-down approach, especially in very complex networks.
![]() In contrast to top-down design, the network design approach in which network devices and technologies are selected first is called bottom-up, or connect-the-dots. This approach often results in an inappropriate network for the required services and is primarily used when a very quick response to the design request is needed. With a bottom-up approach, the risk of having to redesign the network is high.
In contrast to top-down design, the network design approach in which network devices and technologies are selected first is called bottom-up, or connect-the-dots. This approach often results in an inappropriate network for the required services and is primarily used when a very quick response to the design request is needed. With a bottom-up approach, the risk of having to redesign the network is high.
![]() Guidelines for producing a top-down design include the following:
Guidelines for producing a top-down design include the following:
-
 Thoroughly analyze the customer’s requirements.
 -
 Initiate the design from the top of the OSI model. In other words, define the upper OSI layers (application, presentation, and session) first, and then define the lower OSI layers (transport, network, data link, and physical)—the infrastructure (routers, switches, and media) that is required.
 -
 Gather additional data about the network (protocol behavior, scalability requirements, additional requirements from the customer, and so forth) that might influence the logical and physical design. Adapt the design to the new data, as required.
 Top-Down Approach Compared to Bottom-Up Approach
![]() A top-down approach to design has many benefits compared to a bottom-up approach, including the following:
A top-down approach to design has many benefits compared to a bottom-up approach, including the following:
-
 Incorporating the customer organization’s requirements
 -
 Providing the customer and the designer with the “big picture” of the desired network
 -
 Providing a design that is appropriate for both current requirements and future development
![]() The disadvantage of the top-down approach is that it is more time-consuming than the bottom-up approach; it necessitates a requirement analysis so that the design can be adapted to the identified needs.
The disadvantage of the top-down approach is that it is more time-consuming than the bottom-up approach; it necessitates a requirement analysis so that the design can be adapted to the identified needs.
![]() A benefit of the bottom-up approach—selecting the devices and technologies and then moving toward services and applications—is that it allows a quick response to a design request. This design approach facilitates designs based on the designer’s previous experience.
A benefit of the bottom-up approach—selecting the devices and technologies and then moving toward services and applications—is that it allows a quick response to a design request. This design approach facilitates designs based on the designer’s previous experience.
![]() The major disadvantage of the bottom-up approach is that it can result in an inappropriate design, leading to costly redesign.
The major disadvantage of the bottom-up approach is that it can result in an inappropriate design, leading to costly redesign.
 Top-Down Design Example
![]() Consider an example that uses the basics of the top-down approach when designing an IP telephony network solution. In this example, the customer requires a network that can support IP telephony. IP telephony permits the use of the same network resources for both data and voice transport, thus reducing the costs of having two separate networks. To achieve this, the network must support Voice over IP (VoIP) technology; this first step in the design process is illustrated in Figure 2-19.
Consider an example that uses the basics of the top-down approach when designing an IP telephony network solution. In this example, the customer requires a network that can support IP telephony. IP telephony permits the use of the same network resources for both data and voice transport, thus reducing the costs of having two separate networks. To achieve this, the network must support Voice over IP (VoIP) technology; this first step in the design process is illustrated in Figure 2-19.
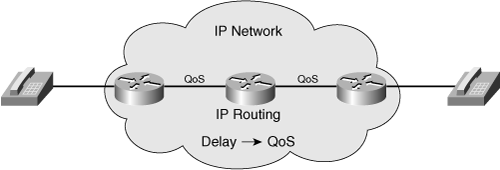
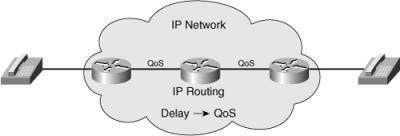
![]() Figure 2-20 illustrates the addition of an IP-based network, which is required to support VoIP. The network includes IP-enabled routers and other devices not shown in the figure. The IP network’s delay is also managed; to achieve this, specific QoS mechanisms are also implemented in the network, as indicated in Figure 2-20.
Figure 2-20 illustrates the addition of an IP-based network, which is required to support VoIP. The network includes IP-enabled routers and other devices not shown in the figure. The IP network’s delay is also managed; to achieve this, specific QoS mechanisms are also implemented in the network, as indicated in Figure 2-20.
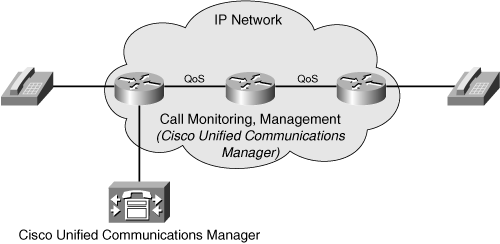
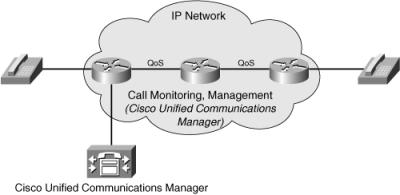
![]() Figure 2-21 illustrates the addition of the call monitoring and management function. This function was previously overlooked because such functions were traditionally handled by a PBX on a separate voice network; during the top-down design, it became clear that this function is necessary. A Cisco Unified Communications Manager is therefore placed inside the network to manage and monitor IP telephone calls.
Figure 2-21 illustrates the addition of the call monitoring and management function. This function was previously overlooked because such functions were traditionally handled by a PBX on a separate voice network; during the top-down design, it became clear that this function is necessary. A Cisco Unified Communications Manager is therefore placed inside the network to manage and monitor IP telephone calls.
| Note |
|
 Decision Tables in Network Design
![]() Decision tables are used for making systematic decisions when there are multiple solutions or options to a network issue or problem. Decision tables facilitate the selection of the most appropriate option from many possibilities and can be helpful for justifying why a certain solution was chosen. Options are usually selected based on the highest level of compliance with given requirements. Basic guidelines for creating a network design decision table include the following:
Decision tables are used for making systematic decisions when there are multiple solutions or options to a network issue or problem. Decision tables facilitate the selection of the most appropriate option from many possibilities and can be helpful for justifying why a certain solution was chosen. Options are usually selected based on the highest level of compliance with given requirements. Basic guidelines for creating a network design decision table include the following:
|
|
|
|
|
|
|
|
|
|
|
|
|
|
|
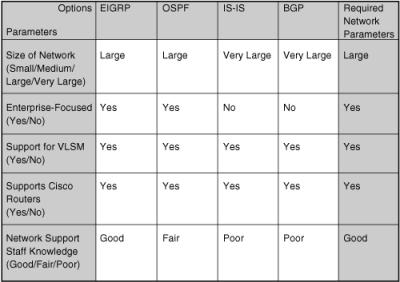
![]() Figure 2-22 is an example of a decision table for selecting a routing protocol based on multiple criteria. In this example, several routing protocols are considered as possible options: OSPF, Intermediate System–to–Intermediate System (IS-IS), Enhanced Interior Gateway Routing Protocol (EIGRP), and BGP. Five required parameters are listed, along with an indication of how well the routing protocols comply with these parameters. As indicated in the figure, the chosen protocol should include the following properties:
Figure 2-22 is an example of a decision table for selecting a routing protocol based on multiple criteria. In this example, several routing protocols are considered as possible options: OSPF, Intermediate System–to–Intermediate System (IS-IS), Enhanced Interior Gateway Routing Protocol (EIGRP), and BGP. Five required parameters are listed, along with an indication of how well the routing protocols comply with these parameters. As indicated in the figure, the chosen protocol should include the following properties:
-
 It should support a large network. All the protocols being considered meet this requirement.
 -
 It must be Enterprise-focused, rather than Internet service provider–focused. BGP was designed to support interconnecting networks of autonomous systems; it is not optimized for use in the enterprise. IS-IS is typically deployed in service provider environments, rather than in enterprises.
 -
 Support for variable-length subnet mask (VLSM) is required. All the protocols being considered support VLSM.
 -
 It must be supported on Cisco routers, which is the case for all the protocols being considered.
 -
 Network support staff should have a good knowledge of the chosen protocol to enable them to troubleshoot the network. In this case, the network support staff are knowledgeable about EIGRP, but not about OSPF, IS-IS, or BGP.
| Note |
|
![]() Based on the stated requirements, EIGRP is the routing protocol of choice in this example.
Based on the stated requirements, EIGRP is the routing protocol of choice in this example.
 Structured Design
![]() The output of the design should be a model of the complete system. The top-down approach is highly recommended. Rather than focusing on the network components, technologies, or protocols, instead focus on the business goals, technical objectives, and existing and future network applications and services.
The output of the design should be a model of the complete system. The top-down approach is highly recommended. Rather than focusing on the network components, technologies, or protocols, instead focus on the business goals, technical objectives, and existing and future network applications and services.
![]() Structured design focuses on a systematic approach, dividing the design task into related, less complex components, as follows:
Structured design focuses on a systematic approach, dividing the design task into related, less complex components, as follows:
-
 First, identify the applications needed to support the customer’s requirements.
 -
 Next, identify the applications’ logical connectivity requirements, with a focus on the necessary infrastructure services and network infrastructure.
 -
 Split the network functionally to develop the network infrastructure and hierarchy requirements.
Note  This book uses the Cisco Enterprise Architecture to provide consistent infrastructure modularization, as described in Chapter 3.
 -
 Design each of the functional elements separately, yet in relation to other elements. For example, the network infrastructure and infrastructure services designs are tightly connected; they are both bound to the same logical, physical, and functional models. Use the top-down approach during all designs.
![]() After identifying the connectivity requirements, the designer works on each of the functional module’s details. The network infrastructure and infrastructure services are composed of logical structures. Each of these structures (such as addressing, routing protocols, QoS, security, and so forth) must be designed separately, but in close relation to other structures, with a goal of creating one homogenous network.
After identifying the connectivity requirements, the designer works on each of the functional module’s details. The network infrastructure and infrastructure services are composed of logical structures. Each of these structures (such as addressing, routing protocols, QoS, security, and so forth) must be designed separately, but in close relation to other structures, with a goal of creating one homogenous network.
![]() Some logical structures are more closely related than others. Network infrastructure elements are more closely related to each other than to infrastructure services, and infrastructure services are more closely related to each other than to network infrastructure elements. For example, physical topology and addressing design are very closely related, whereas addressing and QoS design are not.
Some logical structures are more closely related than others. Network infrastructure elements are more closely related to each other than to infrastructure services, and infrastructure services are more closely related to each other than to network infrastructure elements. For example, physical topology and addressing design are very closely related, whereas addressing and QoS design are not.
![]() Several approaches to physically structuring a network module exist. The most common approach is a three-layer hierarchical structure: core, distribution, and access. In this approach, three separate, yet related, physical structures are developed instead of a single, large network, resulting in meaningful and functionally homogeneous elements within each layer. Selecting the functionality and required technologies is easier when it is applied to separate structured network elements than when it is applied to the complex network.
Several approaches to physically structuring a network module exist. The most common approach is a three-layer hierarchical structure: core, distribution, and access. In this approach, three separate, yet related, physical structures are developed instead of a single, large network, resulting in meaningful and functionally homogeneous elements within each layer. Selecting the functionality and required technologies is easier when it is applied to separate structured network elements than when it is applied to the complex network.
| Note |
|
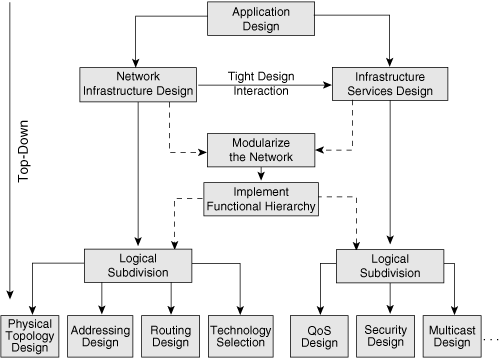
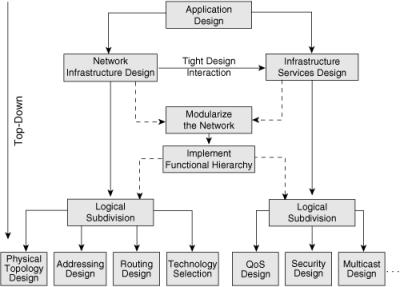
![]() Figure 2-23 is an example of how a network design can be divided into smaller, yet related sections using structured design practices.
Figure 2-23 is an example of how a network design can be divided into smaller, yet related sections using structured design practices.
![]() In this example, network infrastructure design and infrastructure services design are tightly connected; both are bound to the same logical, physical, and functional models. These elements are subdivided logically. The network infrastructure design is subdivided into physical topology design, addressing design, routing design, and technology selection. The infrastructure services design is subdivided into QoS design, security design, and multicast design. All design phases use the top-down approach.
In this example, network infrastructure design and infrastructure services design are tightly connected; both are bound to the same logical, physical, and functional models. These elements are subdivided logically. The network infrastructure design is subdivided into physical topology design, addressing design, routing design, and technology selection. The infrastructure services design is subdivided into QoS design, security design, and multicast design. All design phases use the top-down approach.
 Network Design Tools
![]() Several types of tools can be used to ease the task of designing a complex modern network, including the following:
Several types of tools can be used to ease the task of designing a complex modern network, including the following:
-
 Network modeling tools: Network modeling tools are helpful when a lot of input design information (such as customer requirements, network audit and analysis results, and so on) exists. Network modeling tools enable modeling of both simple and complex networks. The tools process the information provided and return a proposed configuration, which can be modified and reprocessed to add redundant links, support additional sites, and so forth.
 -
 Strategic analysis tools: Strategic analysis or what-if tools help designers and other people who are working on the design (engineers, technologists, and business and marketing professionals) to develop network and service plans, including detailed technical and business analysis. These tools attempt to calculate the effects of specific network components through simulated scenarios.
 -
 Decision tables: As discussed, decision tables are manual tools for choosing specific network characteristics from multiple options, based on required parameters.
 -
 Simulation and verification tools or services: These tools or services are used to verify the acquired design, thereby lessening the need for a pilot network implementation.
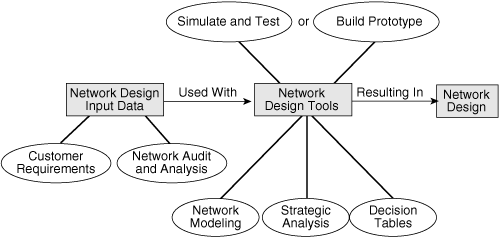
![]() Figure 2-24 illustrates how the initial requirements information is processed with network design tools to produce a network design.
Figure 2-24 illustrates how the initial requirements information is processed with network design tools to produce a network design.
![]() To verify a network design that was produced with the help of network modeling tools, strategic analysis tools, and decision tables, either use simulation and test tools or build a pilot or prototype network. The pilot or prototype network also creates a proof of concept that confirms the appropriateness of the design implementation plan.
To verify a network design that was produced with the help of network modeling tools, strategic analysis tools, and decision tables, either use simulation and test tools or build a pilot or prototype network. The pilot or prototype network also creates a proof of concept that confirms the appropriateness of the design implementation plan.
 Building a Prototype or Pilot Network
![]() It is often desirable to verify a design before implementation. A design can be tested in an existing, or live, network—this is called a pilot—or, preferably, in a prototype network that does not affect the existing network. A successful design implementation in either a pilot or prototype network can be used as a proof of concept in preparation for full implementation and can be used as input to the implementation steps.
It is often desirable to verify a design before implementation. A design can be tested in an existing, or live, network—this is called a pilot—or, preferably, in a prototype network that does not affect the existing network. A successful design implementation in either a pilot or prototype network can be used as a proof of concept in preparation for full implementation and can be used as input to the implementation steps.
![]() It is important that the pilot or prototype test the design, including the customer’s most important stated requirements. For example, if a key requirement is minimal response time for remote users, ensure that the prototype or pilot verifies that the maximum acceptable response time is not exceeded.
It is important that the pilot or prototype test the design, including the customer’s most important stated requirements. For example, if a key requirement is minimal response time for remote users, ensure that the prototype or pilot verifies that the maximum acceptable response time is not exceeded.
![]() A prototype or pilot implementation can have one of two results:
A prototype or pilot implementation can have one of two results:
-
 Success: This result is usually enough to prove the design concept.
 -
 Failure: This result is normally used to correct the design; the prototype or pilot phase is then repeated. In the case of small deviations, the design can be corrected and tested in the prototype or pilot network immediately.
![]() Figure 2-25 is a sample topology subset of a planned network. The highlighted areas indicate the parts of the network involved in a redesign. This part of the topology is implemented first in a prototype to verify the design.
Figure 2-25 is a sample topology subset of a planned network. The highlighted areas indicate the parts of the network involved in a redesign. This part of the topology is implemented first in a prototype to verify the design.
 Documenting the Design
![]() A design document lists the design requirements, documents the existing network and the network design, identifies the proof-of-concept strategy and results, and details the implementation plan. The final design document structure should be similar to the one in Figure 2-26, which includes the following:
A design document lists the design requirements, documents the existing network and the network design, identifies the proof-of-concept strategy and results, and details the implementation plan. The final design document structure should be similar to the one in Figure 2-26, which includes the following:
-
 Introduction: Every design document should include an introduction to present the main reasons leading to the network design or redesign.
 -
 Design requirements: Also a mandatory part of any design document, this section includes the organization’s requirements and design goals that must be fulfilled.
 -
 Existing network infrastructure: This section is required only for a network redesign. The subsections document the results of the existing network characterization steps.
 -
 Design: This section is an essential part of the design document and identifies the design and implementation details. The design details documented will obviously differ depending on the type of design project (whether it is a completely new network, a network redesign, or simply a new service introduction, for example), but they typically include the topology, addressing, and design. Implementation details, such as configuration templates and exact configurations of network devices, are included to ease the implementation process.
 -
 Proof of concept: This section describes the pilot or prototype network verification and test results.
 -
 Implementation plan: This section provides the implementation details that technical staff need to carry out as quickly and smoothly as possible, without requiring the presence of the designer.
 -
 Appendixes: The appendixes usually include lists and, optionally, configurations of existing network devices.


0 comments
Post a Comment