IP SLAs
![]() Enterprises are under increasing pressure to offer SLAs to their internal customers or other departments and to verify and measure SLAs of outsourced services. The embedded Cisco IOS IP SLAs measurement capability allows network managers to validate network performance, proactively identify network issues, and verify service guarantees by using active monitoring to generate probe traffic in a continuous, reliable, and predictable manner.
Enterprises are under increasing pressure to offer SLAs to their internal customers or other departments and to verify and measure SLAs of outsourced services. The embedded Cisco IOS IP SLAs measurement capability allows network managers to validate network performance, proactively identify network issues, and verify service guarantees by using active monitoring to generate probe traffic in a continuous, reliable, and predictable manner.
IP SLAs Overview
![]() The network has become increasingly critical for customers, and any downtime or degradation can adversely impact revenue. Therefore, companies need some form of predictability with IP services.
The network has become increasingly critical for customers, and any downtime or degradation can adversely impact revenue. Therefore, companies need some form of predictability with IP services.
 SLAs
SLAs
![]() An SLA is a contract between a network provider and its customers, or between a network department and internal corporate customers, that specifies connectivity and performance agreements for an end-user service. It provides a form of guarantee to customers about the level of user experience.
An SLA is a contract between a network provider and its customers, or between a network department and internal corporate customers, that specifies connectivity and performance agreements for an end-user service. It provides a form of guarantee to customers about the level of user experience.
![]() An SLA typically outlines the minimum and expected level of service. For example, an IT department can use SLAs to verify that the service provider is meeting its own SLAs or to define service levels for critical business applications. An SLA can also be used as the basis for planning budgets and justifying network expenditures. SLAs also support problem isolation, allowing administrators to reduce the mean time to repair (MTTR). Network configurations and other changes can be planned based on optimized performance metrics from SLAs.
An SLA typically outlines the minimum and expected level of service. For example, an IT department can use SLAs to verify that the service provider is meeting its own SLAs or to define service levels for critical business applications. An SLA can also be used as the basis for planning budgets and justifying network expenditures. SLAs also support problem isolation, allowing administrators to reduce the mean time to repair (MTTR). Network configurations and other changes can be planned based on optimized performance metrics from SLAs.
![]() Typically, the technical components of an SLA contain a guarantee level for network availability, network performance in terms of round-trip time (RTT), and network response in terms of latency, jitter, and packet loss. The specifics of an SLA vary depending on the applications an organization is supporting in the network.
Typically, the technical components of an SLA contain a guarantee level for network availability, network performance in terms of round-trip time (RTT), and network response in terms of latency, jitter, and packet loss. The specifics of an SLA vary depending on the applications an organization is supporting in the network.
![]() For example, converged IP networks must be optimized for performance levels, including delay, packet loss, jitter, packet sequencing, and connectivity to gauge the QoS experienced by an end user.
For example, converged IP networks must be optimized for performance levels, including delay, packet loss, jitter, packet sequencing, and connectivity to gauge the QoS experienced by an end user.
![]() Table 12-1 shows typical multimedia service requirements, which are more stringent than data-only requirements.
Table 12-1 shows typical multimedia service requirements, which are more stringent than data-only requirements.
|
|
|
|
|
|---|---|---|---|
|
|
|
|
|
|
|
|
|
|
|
|
|
|
|
| Note |
|
 IP SLAs Measurements
![]() The embedded IOS IP SLAs measurement capability helps create a network that is “performance aware.” Using IP SLAs measurements, Cisco network equipment can verify service guarantees, validate network performance, improve network reliability, proactively identify network issues, and react to performance metrics with changes to the configuration and network.
The embedded IOS IP SLAs measurement capability helps create a network that is “performance aware.” Using IP SLAs measurements, Cisco network equipment can verify service guarantees, validate network performance, improve network reliability, proactively identify network issues, and react to performance metrics with changes to the configuration and network.
| Note |
|
![]() The Cisco IOS IP SLAs feature allows performance measurements to be taken within and between Cisco devices, or between a Cisco device and a host, providing data about service levels for IP applications and services.
The Cisco IOS IP SLAs feature allows performance measurements to be taken within and between Cisco devices, or between a Cisco device and a host, providing data about service levels for IP applications and services.
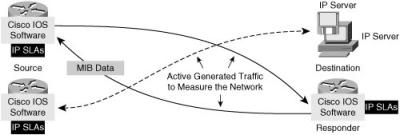
![]() IP SLAs measurements perform active monitoring by generating and analyzing traffic to measure performance between Cisco IOS Software devices or between a Cisco IOS device and a host, such as a network application server. With the IP SLAs feature enabled, a router sends synthetic traffic to the other device, as illustrated in Figure 12-17.
IP SLAs measurements perform active monitoring by generating and analyzing traffic to measure performance between Cisco IOS Software devices or between a Cisco IOS device and a host, such as a network application server. With the IP SLAs feature enabled, a router sends synthetic traffic to the other device, as illustrated in Figure 12-17.
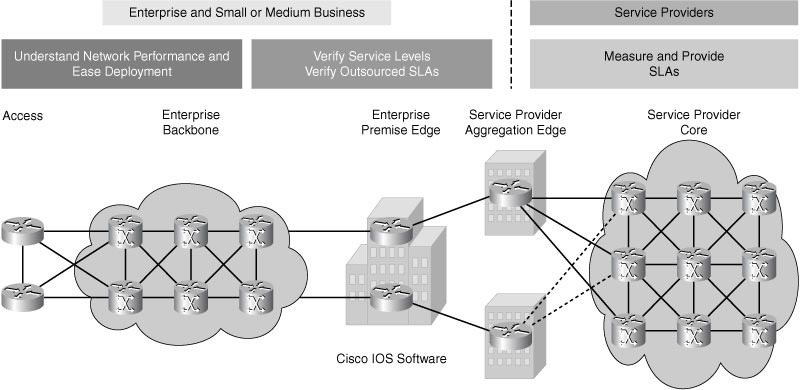
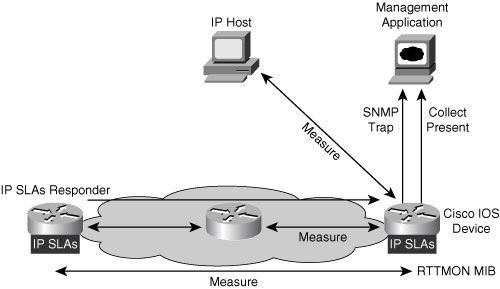
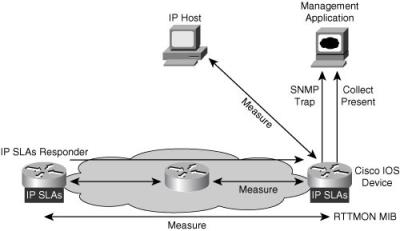
![]() Figure 12-18 illustrates example IP SLAs goals in various parts of a network.
Figure 12-18 illustrates example IP SLAs goals in various parts of a network.
![]() Common uses for IP SLAs measurement data include the following:
Common uses for IP SLAs measurement data include the following:
-
 Edge-to-edge network availability monitoring
 -
 Network performance monitoring and network performance visibility
 -
 VoIP, video, and virtual private network (VPN) monitoring
 -
 SLA monitoring
 -
 IP service network health readiness or assessment
 -
 MPLS network monitoring
 -
 Troubleshooting network operations
![]() IP SLAs measurement uses a variety of operations and actively generated traffic probes to gather many types of measurement statistics, including the following:
IP SLAs measurement uses a variety of operations and actively generated traffic probes to gather many types of measurement statistics, including the following:
-
 Network latency and response times
 -
 Packet-loss statistics
 -
 Network jitter and voice quality scores
 -
 Statistical end-to-end matrix of performance information
 -
 End-to-end network connectivity
![]() Multiple IP SLAs measurements can be running in a network simultaneously. Reporting tools use SNMP to extract the data into a database and allow the user to examine and analyze the data.
Multiple IP SLAs measurements can be running in a network simultaneously. Reporting tools use SNMP to extract the data into a database and allow the user to examine and analyze the data.
 IP SLAs Capability Support
![]() The IP SLAs measurement capability has comprehensive hardware support. Most Cisco devices that run Cisco IOS Software support IP SLAs measurements. IP SLAs measurement data collection and reporting support is included in several third-party partner performance management products.
The IP SLAs measurement capability has comprehensive hardware support. Most Cisco devices that run Cisco IOS Software support IP SLAs measurements. IP SLAs measurement data collection and reporting support is included in several third-party partner performance management products.
![]() Because IP SLAs measurements are embedded within Cisco IOS Software, no additional devices need be deployed, learned, or managed. Therefore, IP SLAs measurements provide a scalable, cost-effective solution for network performance measurement.
Because IP SLAs measurements are embedded within Cisco IOS Software, no additional devices need be deployed, learned, or managed. Therefore, IP SLAs measurements provide a scalable, cost-effective solution for network performance measurement.
IP SLAs Functions
![]() This section describes IP SLAs terminology and operations.
This section describes IP SLAs terminology and operations.
 IP SLAs Source and Responder
![]() All the IP SLAs measurement probe operations are configured on the IP SLAs source, either by the CLI or through an SNMP tool that supports IP SLAs operation. The ip sla global configuration command enters IP SLAs configuration mode to begin configuring an IP SLAs operation. (The ip sla command replaces the ip sla monitor command in Cisco IOS Release 12.4(4)T.)
All the IP SLAs measurement probe operations are configured on the IP SLAs source, either by the CLI or through an SNMP tool that supports IP SLAs operation. The ip sla global configuration command enters IP SLAs configuration mode to begin configuring an IP SLAs operation. (The ip sla command replaces the ip sla monitor command in Cisco IOS Release 12.4(4)T.)
![]() The source sends probe packets to the target.
The source sends probe packets to the target.
![]() There are two types of IP SLAs operations: those in which the target device is running the IP SLAs responder component, and those in which the target device is not running the IP SLAs responder component (such as when the target is a web server or IP host).
There are two types of IP SLAs operations: those in which the target device is running the IP SLAs responder component, and those in which the target device is not running the IP SLAs responder component (such as when the target is a web server or IP host).
![]() A Cisco IOS device is configured as an IP SLAs responder with the ip sla responder global configuration command and does not require any complex or per-operation configuration. (The ip sla responder command replaces the ip sla monitor responder command in Cisco IOS release 12.4(4)T.)
A Cisco IOS device is configured as an IP SLAs responder with the ip sla responder global configuration command and does not require any complex or per-operation configuration. (The ip sla responder command replaces the ip sla monitor responder command in Cisco IOS release 12.4(4)T.)
![]() The IP SLAs measurement accuracy is improved when the target is an IP SLAs responder, as described in the upcoming “IP SLAs Operation with Responder” section.
The IP SLAs measurement accuracy is improved when the target is an IP SLAs responder, as described in the upcoming “IP SLAs Operation with Responder” section.
 IP SLAs Operations
![]() An IP SLAs operation is a measurement that includes protocol, frequency, traps, and thresholds.
An IP SLAs operation is a measurement that includes protocol, frequency, traps, and thresholds.
![]() The network manager configures the IP SLAs source with the target device address, protocol, and UDP or TCP port number, for each operation. When the operation is finished and the response is received, the results are stored in the IP SLAs MIB on the source, and are retrieved using SNMP.
The network manager configures the IP SLAs source with the target device address, protocol, and UDP or TCP port number, for each operation. When the operation is finished and the response is received, the results are stored in the IP SLAs MIB on the source, and are retrieved using SNMP.
![]() IP SLAs operations are specific to target devices. Operations such as Domain Name System (DNS) or HTTP can be sent to any suitable computer. However, for operations such as testing the port used by a database, there may be risks associated with unexpected effects on actual database servers, and therefore IP SLAs responder functionality on a router can be configured to respond in place of the actual database server.
IP SLAs operations are specific to target devices. Operations such as Domain Name System (DNS) or HTTP can be sent to any suitable computer. However, for operations such as testing the port used by a database, there may be risks associated with unexpected effects on actual database servers, and therefore IP SLAs responder functionality on a router can be configured to respond in place of the actual database server.
 IP SLAs Operation with Responder
![]() Using an IP SLAs responder provides enhanced measurement accuracy—without the need for dedicated third-party external probe devices—and additional statistics that are not otherwise available via standard Internet Control Message Protocol (ICMP)-based measurements.
Using an IP SLAs responder provides enhanced measurement accuracy—without the need for dedicated third-party external probe devices—and additional statistics that are not otherwise available via standard Internet Control Message Protocol (ICMP)-based measurements.
![]() When a network manager configures an IP SLAs operation on the IP SLAs source, reaction conditions can also be defined, and the operation can be scheduled to be run for a period of time to gather statistics. The source uses the IP SLAs control protocol to communicate with the responder before sending test packets. To increase security of IP SLAs control messages, message digest 5 (MD5) authentication can be used to secure the control protocol exchange.
When a network manager configures an IP SLAs operation on the IP SLAs source, reaction conditions can also be defined, and the operation can be scheduled to be run for a period of time to gather statistics. The source uses the IP SLAs control protocol to communicate with the responder before sending test packets. To increase security of IP SLAs control messages, message digest 5 (MD5) authentication can be used to secure the control protocol exchange.
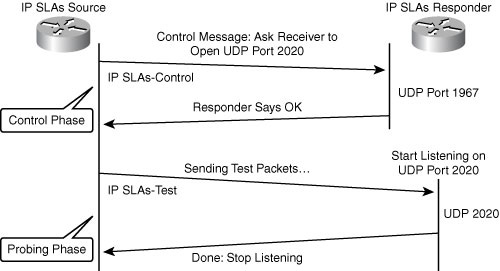
![]() The following sequence of events occurs for each IP SLAs operation that requires a responder on the target, as illustrated in Figure 12-19:
The following sequence of events occurs for each IP SLAs operation that requires a responder on the target, as illustrated in Figure 12-19:
|
|
|
|
|
|
|
|
|
|
|
|
| Note |
|
 IP SLAs with Responder Timestamps
![]() Figure 12-20 illustrates the use of timestamps in round-trip calculations in an operation using an IP SLAs responder. The IP SLA source uses four timestamps for the RTT calculation.
Figure 12-20 illustrates the use of timestamps in round-trip calculations in an operation using an IP SLAs responder. The IP SLA source uses four timestamps for the RTT calculation.
![]() The IP SLAs source sends a test packet at time T1.
The IP SLAs source sends a test packet at time T1.
![]() Because of other high-priority processes, routers might take tens of milliseconds to process incoming packets. For example, the reply to a test packet might be sitting in a queue waiting to be processed. To account for this delay, the IP SLAs responder includes both the receipt time (T2) and the transmitted time (T3) in the response packet; the timestamps are accurate to submilliseconds.
Because of other high-priority processes, routers might take tens of milliseconds to process incoming packets. For example, the reply to a test packet might be sitting in a queue waiting to be processed. To account for this delay, the IP SLAs responder includes both the receipt time (T2) and the transmitted time (T3) in the response packet; the timestamps are accurate to submilliseconds.
![]() The IP SLAs source subtracts T2 from T3 to determine the delta value—the time spent processing the test packet in the IP SLAs responder. The delta value is subtracted from the overall RTT.
The IP SLAs source subtracts T2 from T3 to determine the delta value—the time spent processing the test packet in the IP SLAs responder. The delta value is subtracted from the overall RTT.
![]() The same principle is applied by IP SLAs source; the incoming timestamp (T4) is taken at the interrupt level to allow for greater accuracy in the RTT calculation. The T4 timestamp, rather than the T5 timestamp—when the packet is processed—is used in the RTT calculation.
The same principle is applied by IP SLAs source; the incoming timestamp (T4) is taken at the interrupt level to allow for greater accuracy in the RTT calculation. The T4 timestamp, rather than the T5 timestamp—when the packet is processed—is used in the RTT calculation.
![]() The two timestamps taken in the IP SLAs responder also allow one-way delay, jitter, and directional packet loss to be tracked. These statistics are critical for understanding asynchronous network behavior. To calculate these one-way delay measurements, the source and target need to be synchronized to the same clock source, requiring the Network Time Protocol (NTP) to be configured on both.
The two timestamps taken in the IP SLAs responder also allow one-way delay, jitter, and directional packet loss to be tracked. These statistics are critical for understanding asynchronous network behavior. To calculate these one-way delay measurements, the source and target need to be synchronized to the same clock source, requiring the Network Time Protocol (NTP) to be configured on both.
 IP SLAs SNMP Features
![]() Compared to NetFlow, which passively monitors the network, IP SLAs measurements actively send data across the network to measure performance between multiple network locations on a hop-by-hop basis or across end-to-end network paths. The IP SLAs measurements are accessible through SNMP.
Compared to NetFlow, which passively monitors the network, IP SLAs measurements actively send data across the network to measure performance between multiple network locations on a hop-by-hop basis or across end-to-end network paths. The IP SLAs measurements are accessible through SNMP.
![]() The Cisco Round-Trip Time Monitor (RTTMON) MIB is used with IP SLAs measurements; the data from the IP SLAs operations is stored within the RTTMON MIB. Network management applications can retrieve network performance statistics from this MIB, as illustrated in Figure 12-21, and network managers can build custom equations to monitor specific statistics.
The Cisco Round-Trip Time Monitor (RTTMON) MIB is used with IP SLAs measurements; the data from the IP SLAs operations is stored within the RTTMON MIB. Network management applications can retrieve network performance statistics from this MIB, as illustrated in Figure 12-21, and network managers can build custom equations to monitor specific statistics.
![]() The RTTMON MIB can store measurements over a period of time. IP SLAs operations can also be configured to measure traffic with different classes of services over the same link using the DSCP in the ToS byte. The tos number command configures these bits; this command is configured in an IP SLAs configuration submode. The number specifies the ToS (DSCP) value. This command is supported by all IP SLAs operations.
The RTTMON MIB can store measurements over a period of time. IP SLAs operations can also be configured to measure traffic with different classes of services over the same link using the DSCP in the ToS byte. The tos number command configures these bits; this command is configured in an IP SLAs configuration submode. The number specifies the ToS (DSCP) value. This command is supported by all IP SLAs operations.
![]() IP SLAs measurements can proactively notify network managers about conditions by using an SNMP trap. Each measurement operation can monitor against a preset performance threshold and generate an SNMP trap to alert management applications if this threshold is crossed. Available thresholds include RTT, average jitter, one-way latency, jitter, packet loss, mean opinion score (MOS), and connectivity tests. IP SLAs measurements can also be configured to run a new SNMP operation automatically when a threshold is crossed after a configurable number of times. For example, if the latency threshold is exceeded three times, a secondary operation could measure hop-by-hop latencies to help isolate the problem area in the network.
IP SLAs measurements can proactively notify network managers about conditions by using an SNMP trap. Each measurement operation can monitor against a preset performance threshold and generate an SNMP trap to alert management applications if this threshold is crossed. Available thresholds include RTT, average jitter, one-way latency, jitter, packet loss, mean opinion score (MOS), and connectivity tests. IP SLAs measurements can also be configured to run a new SNMP operation automatically when a threshold is crossed after a configurable number of times. For example, if the latency threshold is exceeded three times, a secondary operation could measure hop-by-hop latencies to help isolate the problem area in the network.
Deploying IP SLAs Measurements
![]() The first step in IP SLAs deployment is determining exactly what needs to be monitored. Table 12-2 shows the requirements and resulting common IP SLAs measurements for several network profiles.
The first step in IP SLAs deployment is determining exactly what needs to be monitored. Table 12-2 shows the requirements and resulting common IP SLAs measurements for several network profiles.
|
|
|
|
|
| |
|---|---|---|---|---|---|
|
|
|
|
|
|
|
|
|
|
|
|
|
|
![]() A variety of IP SLAs operations support different deployment profiles. The most common operation used is the UDP jitter operation, which measures IP performance for UDP performance-sensitive applications. The UDP jitter operation measurements include round-trip delay, one-way jitter, one-way packet loss, and connectivity testing. Other operations include ICMP path jitter—for measuring hop-by-hop jitter, packet loss, and delay—and UDP jitter for VoIP—with all the features of the UDP jitter operation, plus codec simulation and voice-quality scoring capabilities.
A variety of IP SLAs operations support different deployment profiles. The most common operation used is the UDP jitter operation, which measures IP performance for UDP performance-sensitive applications. The UDP jitter operation measurements include round-trip delay, one-way jitter, one-way packet loss, and connectivity testing. Other operations include ICMP path jitter—for measuring hop-by-hop jitter, packet loss, and delay—and UDP jitter for VoIP—with all the features of the UDP jitter operation, plus codec simulation and voice-quality scoring capabilities.
![]() As noted in Table 12-2, data-only deployments typically seek to minimize delay and packet loss. Appropriate IP SLAs measurements for these scenarios are jitter, packer loss, and latency measurements using the UDP jitter operation.
As noted in Table 12-2, data-only deployments typically seek to minimize delay and packet loss. Appropriate IP SLAs measurements for these scenarios are jitter, packer loss, and latency measurements using the UDP jitter operation.
![]() With the addition of real-time traffic such as VoIP, delays, jitter, and packet loss are still very important. For VoIP traffic, packet loss is manageable to some extent, but frequent losses impair communication. The UDP jitter for VoIP operation provides packet loss, jitter, and latency measurements, including unidirectional measurements, plus MOS voice-quality scores.
With the addition of real-time traffic such as VoIP, delays, jitter, and packet loss are still very important. For VoIP traffic, packet loss is manageable to some extent, but frequent losses impair communication. The UDP jitter for VoIP operation provides packet loss, jitter, and latency measurements, including unidirectional measurements, plus MOS voice-quality scores.
 Impact of QoS Deployment on IP SLAs Statistics
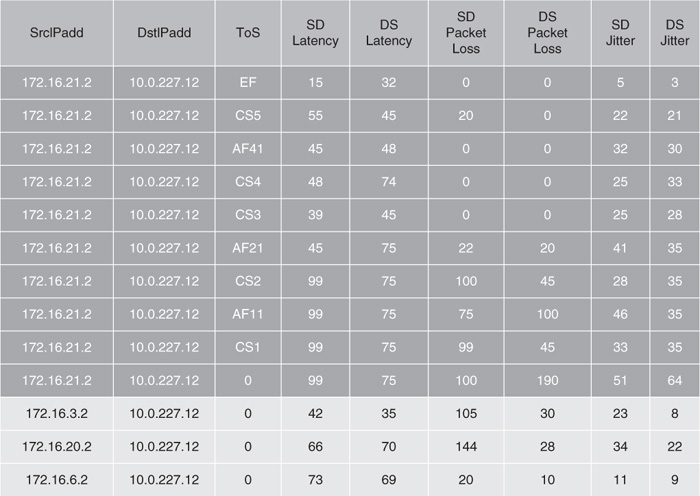
![]() The highlighted line in the example in Figure 12-22 shows the IP SLAs statistics for a particular flow before QoS is deployed in the network. Notice that the ToS field is 0.
The highlighted line in the example in Figure 12-22 shows the IP SLAs statistics for a particular flow before QoS is deployed in the network. Notice that the ToS field is 0.
| Note |
|
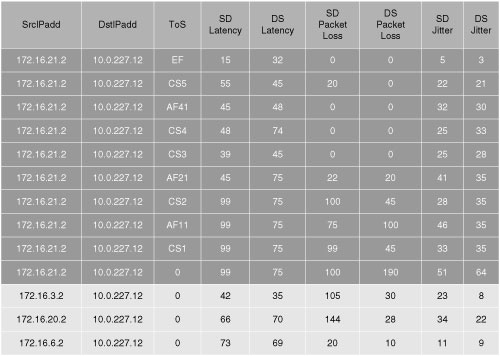
![]() Figure 12-23 shows the IP SLAs statistics from the same operation spread across multiple flows after QoS has been deployed in the network. In this case, a measurement is taken for each ToS value monitored. The varied results per ToS show that the QoS performance per class is working end-to-end through the network.
Figure 12-23 shows the IP SLAs statistics from the same operation spread across multiple flows after QoS has been deployed in the network. In this case, a measurement is taken for each ToS value monitored. The varied results per ToS show that the QoS performance per class is working end-to-end through the network.
![]() QoS is used for providing preferential treatment for certain traffic classes. Therefore, if you have QoS configured and IP SLAs shows that all your traffic is getting the same treatment, either the network is not congested or your QoS configuration is not working properly.
QoS is used for providing preferential treatment for certain traffic classes. Therefore, if you have QoS configured and IP SLAs shows that all your traffic is getting the same treatment, either the network is not congested or your QoS configuration is not working properly.
 Scaling IP SLAs Deployments
![]() The processing requirements for IP SLAs operations may be a concern when there is a large amount of switching traffic passing through an IP SLAs source. In these cases, it is necessary to reduce the frequency of the sampling interval or use a dedicated IP SLAs router to perform the IP SLAs measurement operations.
The processing requirements for IP SLAs operations may be a concern when there is a large amount of switching traffic passing through an IP SLAs source. In these cases, it is necessary to reduce the frequency of the sampling interval or use a dedicated IP SLAs router to perform the IP SLAs measurement operations.
![]() A dedicated router for sourcing IP SLAs measurement operations—called a shadow router—is used when there is a large number of operations (hundreds or thousands) needed on an IP SLAs source. Dedicated routers are often deployed in large hub-and-spoke topologies, with the dedicated router at the hub site and the spokes as IP SLAs responders.
A dedicated router for sourcing IP SLAs measurement operations—called a shadow router—is used when there is a large number of operations (hundreds or thousands) needed on an IP SLAs source. Dedicated routers are often deployed in large hub-and-spoke topologies, with the dedicated router at the hub site and the spokes as IP SLAs responders.
![]() Advantages of deploying a dedicated router include the following:
Advantages of deploying a dedicated router include the following:
-
 The dedicated router focuses on IP SLAs operations, and therefore its separate memory and CPU are not in the switching path.
 -
 The Cisco IOS Software release on the dedicated router can be upgraded without affecting production devices or traffic.
 -
 Management and deployment is flexible; dedicated routers can be deployed at a hub site or at regional aggregation locations.
 -
 The solution is scalable to a large number of endpoints; a dedicated router allows polling a central source location.
 Hierarchical Monitoring with IP SLAs Measurements
![]() If the number of sites is extremely large, the number of IP SLAs measurements required to test every remote site may be prohibitive for even a dedicated router. An option in this case is to use multiple dedicated routers, with a mesh of IP SLAs measurements taken at multiple points in the network.
If the number of sites is extremely large, the number of IP SLAs measurements required to test every remote site may be prohibitive for even a dedicated router. An option in this case is to use multiple dedicated routers, with a mesh of IP SLAs measurements taken at multiple points in the network.
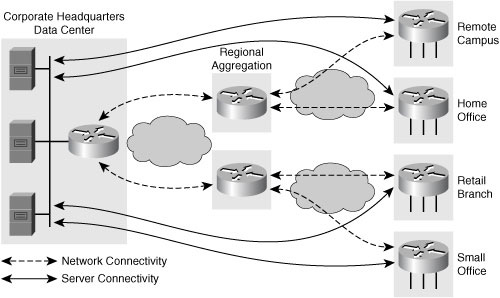
![]() Another option is to use a series of measurements in a hierarchical design, as illustrated in Figure 12-24.
Another option is to use a series of measurements in a hierarchical design, as illustrated in Figure 12-24.
![]() This hierarchical approach allows regional aggregation routers to be the source of IP SLAs measurement traffic for the access routers in each region, and a centralized router to be the source of IP SLAs measurement traffic for the regional aggregation routers. Resulting RTTs can be summed to give an approximate end-to-end measurement. When using a hierarchical deployment, the network manager may need to examine individual measurements if the reporting tools do not correlate end-to-end times. However, threshold violations on single links may be all that are needed to detect a problem.
This hierarchical approach allows regional aggregation routers to be the source of IP SLAs measurement traffic for the access routers in each region, and a centralized router to be the source of IP SLAs measurement traffic for the regional aggregation routers. Resulting RTTs can be summed to give an approximate end-to-end measurement. When using a hierarchical deployment, the network manager may need to examine individual measurements if the reporting tools do not correlate end-to-end times. However, threshold violations on single links may be all that are needed to detect a problem.
Network Management Applications Using IP SLAs Measurements
![]() IP SLAs are supported by both Cisco applications and a wide range of vendor partners’ network management applications that report and use IP SLAs data.
IP SLAs are supported by both Cisco applications and a wide range of vendor partners’ network management applications that report and use IP SLAs data.
![]() Cisco solutions include Cisco Unified Service Monitor for telephony monitoring and CiscoWorks Internetwork Performance Monitor (IPM) for enterprise performance measurements.
Cisco solutions include Cisco Unified Service Monitor for telephony monitoring and CiscoWorks Internetwork Performance Monitor (IPM) for enterprise performance measurements.
 CiscoWorks IPM Application Example
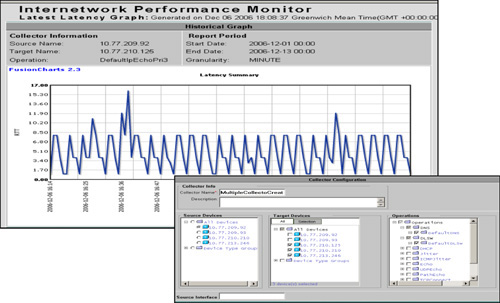
![]() Figure 12-25 shows some images from the CiscoWorks IPM application. CiscoWorks IPM is a network response-time and availability troubleshooting application that measures network performance based on the traffic-generation technology within IP SLAs. CiscoWorks IPM facilitates performance measurement of differentiated services (for example, voice, video, and data) in an enterprise network.
Figure 12-25 shows some images from the CiscoWorks IPM application. CiscoWorks IPM is a network response-time and availability troubleshooting application that measures network performance based on the traffic-generation technology within IP SLAs. CiscoWorks IPM facilitates performance measurement of differentiated services (for example, voice, video, and data) in an enterprise network.
![]() CiscoWorks IPM allows the network response times to be proactively monitored and can notify the network engineer if the response time degrades or a monitored link becomes unavailable, helping pinpoint the link causing the problem.
CiscoWorks IPM allows the network response times to be proactively monitored and can notify the network engineer if the response time degrades or a monitored link becomes unavailable, helping pinpoint the link causing the problem.
![]() CiscoWorks IPM enables the network manager to define a collector consisting of one or many IP SLAs sources, many IP SLAs responders, and many IP SLAs operations.
CiscoWorks IPM enables the network manager to define a collector consisting of one or many IP SLAs sources, many IP SLAs responders, and many IP SLAs operations.
 IP SLAs Network Management Application Considerations
![]() Several design considerations are involved in selecting a network management application to use with IP SLAs measurements.
Several design considerations are involved in selecting a network management application to use with IP SLAs measurements.
![]() One consideration is how the network management application supports provisioning IP SLAs operations. For example, consider whether the network management tool provisions IP SLAs easily, or if manual configuration using the CLI is needed for every IP SLAs source and responder. Manual configuration of every device should be avoided for large deployments.
One consideration is how the network management application supports provisioning IP SLAs operations. For example, consider whether the network management tool provisions IP SLAs easily, or if manual configuration using the CLI is needed for every IP SLAs source and responder. Manual configuration of every device should be avoided for large deployments.
![]() The effort involved in enabling IP SLAs measurements should also be investigated. The ease of setting up and maintaining the application is also important and will help promote the use of the application.
The effort involved in enabling IP SLAs measurements should also be investigated. The ease of setting up and maintaining the application is also important and will help promote the use of the application.
![]() Another consideration is the reporting supported by the network management application. A variety of predefined and customizable reports help provide quick views of results. Hierarchical reporting is becoming an important consideration. If you use hierarchical measurements, you want a tool that supports aggregation of these measurements.
Another consideration is the reporting supported by the network management application. A variety of predefined and customizable reports help provide quick views of results. Hierarchical reporting is becoming an important consideration. If you use hierarchical measurements, you want a tool that supports aggregation of these measurements.
Summary
![]() In this chapter, you learned about the embedded network management tools in the Cisco IOS Software to support application optimization, performance measurement, and SLA verification.
In this chapter, you learned about the embedded network management tools in the Cisco IOS Software to support application optimization, performance measurement, and SLA verification.
![]() Syslog is a Cisco IOS Software process that enables a device to report and save important error and notification messages. The messages can be saved either locally or to a remote logging server. Syslog messages include both messages in a standardized format and output from debug commands. Syslog messages contain up to 80 characters. Some issues with syslog include the severity level is not used consistently, the messages can be verbose, the standard UDP communication mechanism used, and syslog is not a secure mechanism.
Syslog is a Cisco IOS Software process that enables a device to report and save important error and notification messages. The messages can be saved either locally or to a remote logging server. Syslog messages include both messages in a standardized format and output from debug commands. Syslog messages contain up to 80 characters. Some issues with syslog include the severity level is not used consistently, the messages can be verbose, the standard UDP communication mechanism used, and syslog is not a secure mechanism.
![]() The Cisco IOS NetFlow measurement technology measures flows passing through Cisco devices. A NetFlow network flow is a unidirectional sequence of packets between source and destination endpoints and is identified as the combination of seven key fields: source and destination IP address, source and destination port number, layer 3 protocol field, ToS byte, and input interface.
The Cisco IOS NetFlow measurement technology measures flows passing through Cisco devices. A NetFlow network flow is a unidirectional sequence of packets between source and destination endpoints and is identified as the combination of seven key fields: source and destination IP address, source and destination port number, layer 3 protocol field, ToS byte, and input interface.
![]() The NetFlow cache stores IP flow information. The NetFlow export or transport mechanism sends NetFlow data to a network management collector. There are a variety of formats for exporting packets, called export versions. The most common is version 5, but version 9 is the latest format.
The NetFlow cache stores IP flow information. The NetFlow export or transport mechanism sends NetFlow data to a network management collector. There are a variety of formats for exporting packets, called export versions. The most common is version 5, but version 9 is the latest format.
![]() Fields in a flow record that are not key fields are called nonkey fields. Nonkey fields are added to the flow record in the NetFlow cache and exported. Examples of nonkey fields include flow timestamps, BGP next-hop addresses, and IP address subnet masks. With Cisco IOS Flexible NetFlow, the next-generation in NetFlow technology, these nonkey fields are user configurable. A large number of NetFlow collectors are available—including Cisco, freeware, and third-party commercial products—to report and use NetFlow data.
Fields in a flow record that are not key fields are called nonkey fields. Nonkey fields are added to the flow record in the NetFlow cache and exported. Examples of nonkey fields include flow timestamps, BGP next-hop addresses, and IP address subnet masks. With Cisco IOS Flexible NetFlow, the next-generation in NetFlow technology, these nonkey fields are user configurable. A large number of NetFlow collectors are available—including Cisco, freeware, and third-party commercial products—to report and use NetFlow data.
![]() NBAR is an embedded Cisco IOS Software classification engine that provides full packet stateful inspection to identify and classify a wide variety of protocols and applications, including those that use dynamic TCP and UDP port assignments. NBAR Protocol Discovery analyzes application traffic patterns in real time to discover which traffic is running on the network. NBAR develops statistics on protocol traffic on interfaces that can be used to apply specific QoS functionality to traffic classes. Application-recognition modules, known as PDLMs, can be added to provide support for additional applications.
NBAR is an embedded Cisco IOS Software classification engine that provides full packet stateful inspection to identify and classify a wide variety of protocols and applications, including those that use dynamic TCP and UDP port assignments. NBAR Protocol Discovery analyzes application traffic patterns in real time to discover which traffic is running on the network. NBAR develops statistics on protocol traffic on interfaces that can be used to apply specific QoS functionality to traffic classes. Application-recognition modules, known as PDLMs, can be added to provide support for additional applications.
![]() An NBAR flow on an interface is identified by five elements: source and destination IP address, source and destination port, and Layer 3 protocol field. NBAR Protocol Discovery statistics can be viewed from the Cisco IOS CLI or through third-party vendor applications.
An NBAR flow on an interface is identified by five elements: source and destination IP address, source and destination port, and Layer 3 protocol field. NBAR Protocol Discovery statistics can be viewed from the Cisco IOS CLI or through third-party vendor applications.
![]() The Cisco AutoQoS VoIP and AutoQoS for the Enterprise features both use NBAR traffic classification functions to provide a simple, automatic way to enable QoS configurations in conformance with Cisco best-practice recommendations. The two-phase configuration process for the Cisco AutoQoS for the Enterprise feature uses data collected from NBAR to create templates on the configured interface. These templates are used as the basis for creating the class maps and policy maps for the network.
The Cisco AutoQoS VoIP and AutoQoS for the Enterprise features both use NBAR traffic classification functions to provide a simple, automatic way to enable QoS configurations in conformance with Cisco best-practice recommendations. The two-phase configuration process for the Cisco AutoQoS for the Enterprise feature uses data collected from NBAR to create templates on the configured interface. These templates are used as the basis for creating the class maps and policy maps for the network.
![]() An SLA is a contract between a network provider and its customers, or between a network department and internal corporate customers, that specifies connectivity and performance agreements for an end-user service. The embedded Cisco IOS IP SLAs measurement capability provides end-to-end performance measurements by generating and analyzing traffic to measure performance between Cisco IOS Software devices or between a Cisco IOS device and a host, such as a network application server. Jitter, packet loss, and latency are key measurements.
An SLA is a contract between a network provider and its customers, or between a network department and internal corporate customers, that specifies connectivity and performance agreements for an end-user service. The embedded Cisco IOS IP SLAs measurement capability provides end-to-end performance measurements by generating and analyzing traffic to measure performance between Cisco IOS Software devices or between a Cisco IOS device and a host, such as a network application server. Jitter, packet loss, and latency are key measurements.
![]() All the IP SLAs measurement probe operations are configured on the IP SLAs source. The source sends probe packets to the target, which may be a device is running the IP SLAs responder component; the IP SLAs measurement accuracy is improved when the target is an IP SLAs responder. An IP SLAs operation is a measurement that includes protocol, frequency, traps, and thresholds. The most common operation used is the UDP jitter operation, which measures IP performance for UDP performance-sensitive applications.
All the IP SLAs measurement probe operations are configured on the IP SLAs source. The source sends probe packets to the target, which may be a device is running the IP SLAs responder component; the IP SLAs measurement accuracy is improved when the target is an IP SLAs responder. An IP SLAs operation is a measurement that includes protocol, frequency, traps, and thresholds. The most common operation used is the UDP jitter operation, which measures IP performance for UDP performance-sensitive applications.
![]() The IP SLAs measurements are accessible through SNMP. Both Cisco and a wide range of vendor partners’ network management applications report and use IP SLAs data.
The IP SLAs measurements are accessible through SNMP. Both Cisco and a wide range of vendor partners’ network management applications report and use IP SLAs data.
References
![]() For additional information, refer to the following:
For additional information, refer to the following:
-
 Cisco Systems, Inc. “Cisco IOS Software Releases 12.4 Mainline Error and System Messages,” at http://www.cisco.com/en/US/products/ps6350/products_system_message_guides_list.html
 -
 Cisco Systems, Inc. “Cisco IOS Software Releases 12.3T Embedded Syslog Manager (ESM),” at http://www.cisco.com/en/US/products/sw/iosswrel/ps5207/products_feature_guide09186a00801a8516.html
 -
 Cisco Systems, Inc. “Cisco IOS NetFlow Introduction,” at http://www.cisco.com/go/netflow
 -
 Cisco Systems, Inc. “Cisco NetFlow Collection Engine NetFlow Services Solutions Guide,” at http://www.cisco.com/en/US/products/sw/netmgtsw/ps1964/products_implementation_design_guide09186a00800d6a11.html
 -
 Cisco Systems, Inc. “Introduction to Cisco IOS NetFlow - A Technical Overview,” at http://www.cisco.com/en/US/products/ps6601/products_white_paper0900aecd80406232.shtml
 -
 Cisco Systems, Inc. “Cisco IOS IP Service Level Agreements (SLAs) Introduction,” at http://www.cisco.com/go/ipsla
 -
 Cisco Systems, Inc. “Network Based Application Recognition (NBAR) Introduction,” at http://www.cisco.com/go/nbar
 -
 Cisco Systems, Inc. User Guide for Internetwork Performance Monitor 2.6 (With LMS 2.5.1),” at http://www.cisco.com/en/US/products/sw/cscowork/ps1008/products_user_guide_book09186a0080366cf7.html
 -
 Cisco Systems, Inc. “Cisco IOS Release 12.4 T System Message Guide,” at http://www.cisco.com/en/US/products/ps6441/products_system_message_guide_book09186a00806f9890.html
 -
 The Internet Engineering Task Force. RFC 3195: Reliable Delivery for syslog, at http://www.ietf.org/rfc/rfc3195.txt







0 comments
Post a Comment