NBAR
![]() Enterprise applications require different levels of service based on business requirements. These requirements can be translated into network policies. NBAR is an important embedded Cisco IOS Software technology that provides visibility into how network assets are being used by applications.
Enterprise applications require different levels of service based on business requirements. These requirements can be translated into network policies. NBAR is an important embedded Cisco IOS Software technology that provides visibility into how network assets are being used by applications.
NBAR Overview
![]() Traffic classification can help organizations answer many questions about network resources, such as the following:
Traffic classification can help organizations answer many questions about network resources, such as the following:
-
 Which applications run on the network?
 -
 What is the application resource utilization?
 -
 Are users following application usage policies?
 -
 How much bandwidth should be assigned to different QoS classes?
 -
 How should applications (for example, VoIP) be allocated and deployed most efficiently?
![]() NBAR is an embedded Cisco IOS Software classification engine that recognizes and classifies a wide variety of protocols and applications. NBAR provides full packet stateful inspection that identifies applications, including protocols that use dynamic TCP and UDP port assignments.
NBAR is an embedded Cisco IOS Software classification engine that recognizes and classifies a wide variety of protocols and applications. NBAR provides full packet stateful inspection that identifies applications, including protocols that use dynamic TCP and UDP port assignments.
![]() NBAR includes an optional feature called NBAR Protocol Discovery that analyzes application traffic patterns in real time and discovers which traffic is running on the network. NBAR develops statistics on protocol traffic on interfaces.
NBAR includes an optional feature called NBAR Protocol Discovery that analyzes application traffic patterns in real time and discovers which traffic is running on the network. NBAR develops statistics on protocol traffic on interfaces.
![]() NBAR supports the business requirements of an organization by allowing multiple network applications to be classified to deliver more granular identification and control. NBAR can be used as the foundation for applying QoS policies to traffic flows in the network by enabling network administrators to see the variety of protocols and the amount of traffic generated by each protocol. After gathering this information, NBAR enables the network administrator to organize traffic into classes. The network can then be configured to apply the appropriate QoS to these traffic classes, providing different levels of service for specific applications and protocols. NBAR therefore allows better network management by enabling the appropriate level of network resources to be provided for each type of network traffic.
NBAR supports the business requirements of an organization by allowing multiple network applications to be classified to deliver more granular identification and control. NBAR can be used as the foundation for applying QoS policies to traffic flows in the network by enabling network administrators to see the variety of protocols and the amount of traffic generated by each protocol. After gathering this information, NBAR enables the network administrator to organize traffic into classes. The network can then be configured to apply the appropriate QoS to these traffic classes, providing different levels of service for specific applications and protocols. NBAR therefore allows better network management by enabling the appropriate level of network resources to be provided for each type of network traffic.
 NBAR Packet Inspection
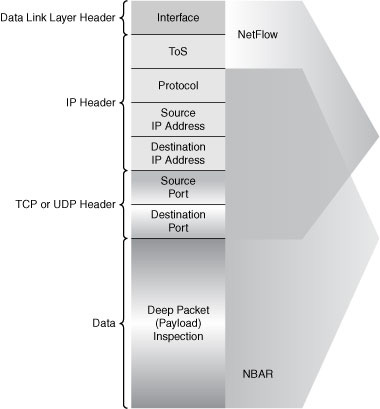
![]() As illustrated in Figure 12-10, NBAR uses the following five elements, from Layers 3 through 7, to identify an NBAR flow on each interface:
As illustrated in Figure 12-10, NBAR uses the following five elements, from Layers 3 through 7, to identify an NBAR flow on each interface:
| Note |
|
![]() NBAR supports several classification methods to identify more than 90 applications and protocols, including the following:
NBAR supports several classification methods to identify more than 90 applications and protocols, including the following:
-
 Statically assigned TCP and UDP port numbers: NBAR can classify application traffic by looking at statically assigned TCP and UDP port numbers. Although ACLs can also be used for classifying static ports, NBAR is easier to configure and provides classification statistics that are not available in ACLs.
 -
 Dynamically assigned TCP and UDP port numbers: NBAR can also classify dynamically assigned TCP and UDP port numbers by using stateful protocol inspection across multiple packets during packet classification. NBAR uses approximately 150 bytes of DRAM for each traffic flow that requires stateful inspection.
 -
 Subport and deep-packet inspection: NBAR looks beyond the port numbers of a packet by looking into the payload itself and classifying packets based on content within the payload, such as the transaction identifier, message type, or other similar data.
 For example, if a packet is classified as HTTP traffic, it may be further classified by URL, host, Multipurpose Internet Mail Extensions (MIME) type, and so forth. NBAR classifies HTTP traffic using text within the URL or host fields of a request using regular expression matching. HTTP URL matching in NBAR supports most HTTP request methods such as GET, PUT, HEAD, POST, DELETE, and TRACE. NBAR converts the specified match string into a regular expression.
 -
 Native and nonnative Packet Description Language Modules (PDLM): NBAR can monitor only applications that it recognizes. However, application-recognition modules, known as PDLMs, can be added to provide support for additional applications. A non-native PDLM is a separate downloadable file available at Cisco.com used to add support for a protocol that is not available as part of the native PDLM currently embedded in the Cisco IOS Software release.
 NBAR also provides custom protocol support for static port-based protocols and applications that are not currently supported in NBAR. There are 10 custom applications that can be assigned using NBAR, and each custom application can have up to 16 TCP and 16 UDP ports each mapped to the individual custom protocol. The real-time statistics of each custom protocol can be monitored using NBAR Protocol Discovery.
| Note |
|
 NBAR Protocol Discovery
![]() NBAR Protocol Discovery discovers any protocol traffic supported by NBAR and gathers real-time statistics associated with that protocol. NBAR Protocol Discovery maintains the following per-protocol statistics for each enabled interface:
NBAR Protocol Discovery discovers any protocol traffic supported by NBAR and gathers real-time statistics associated with that protocol. NBAR Protocol Discovery maintains the following per-protocol statistics for each enabled interface:
-
 Total number of input packets and bytes
 -
 Total number of output packets and bytes
 -
 Input bit rates
 -
 Output bit rates
![]() These statistics can be used to define traffic classes, and traffic policies for each traffic class. The traffic policies or policy maps are used to apply specific QoS features and functionality to the traffic classes.
These statistics can be used to define traffic classes, and traffic policies for each traffic class. The traffic policies or policy maps are used to apply specific QoS features and functionality to the traffic classes.
| Note |
|
 NBAR and NetFlow
![]() NetFlow and NBAR are complementary technologies, as illustrated in Figure 12-11.
NetFlow and NBAR are complementary technologies, as illustrated in Figure 12-11.
![]() Recall that the main objective of NetFlow is to provide visibility into the network behavior and how network assets are being used. In traditional NetFlow, flows are defined by a set of seven key characteristics that define who is using which part of the network for what purposes at what times. NetFlow is a passive technology that monitors network activity, typically from OSI Layers 2 through 4. NetFlow data export allows trending of network records.
Recall that the main objective of NetFlow is to provide visibility into the network behavior and how network assets are being used. In traditional NetFlow, flows are defined by a set of seven key characteristics that define who is using which part of the network for what purposes at what times. NetFlow is a passive technology that monitors network activity, typically from OSI Layers 2 through 4. NetFlow data export allows trending of network records.
![]() Flexible NetFlow can monitor packet information from Layer 2 for switching environments, Layer 3 and 4 for IP information, and up to Layer 7 with deep-packet inspection for application monitoring.
Flexible NetFlow can monitor packet information from Layer 2 for switching environments, Layer 3 and 4 for IP information, and up to Layer 7 with deep-packet inspection for application monitoring.
![]() In contrast, the main objective of NBAR is to identify and classify traffic based on payload attributes and protocol characteristics. NBAR flows are defined by a set of five key characteristics for each interface. NBAR can support static and stateful dynamic inspections and QoS mechanisms can be applied to the classified packets to support optimization of application performance. NBAR is an active technology that can be used to validate or reclassify ToS marking based on packet inspection in Layers 3 through 7. NBAR Protocol Discovery provides an easy way to discover the application protocols that are operating on an interface.
In contrast, the main objective of NBAR is to identify and classify traffic based on payload attributes and protocol characteristics. NBAR flows are defined by a set of five key characteristics for each interface. NBAR can support static and stateful dynamic inspections and QoS mechanisms can be applied to the classified packets to support optimization of application performance. NBAR is an active technology that can be used to validate or reclassify ToS marking based on packet inspection in Layers 3 through 7. NBAR Protocol Discovery provides an easy way to discover the application protocols that are operating on an interface.
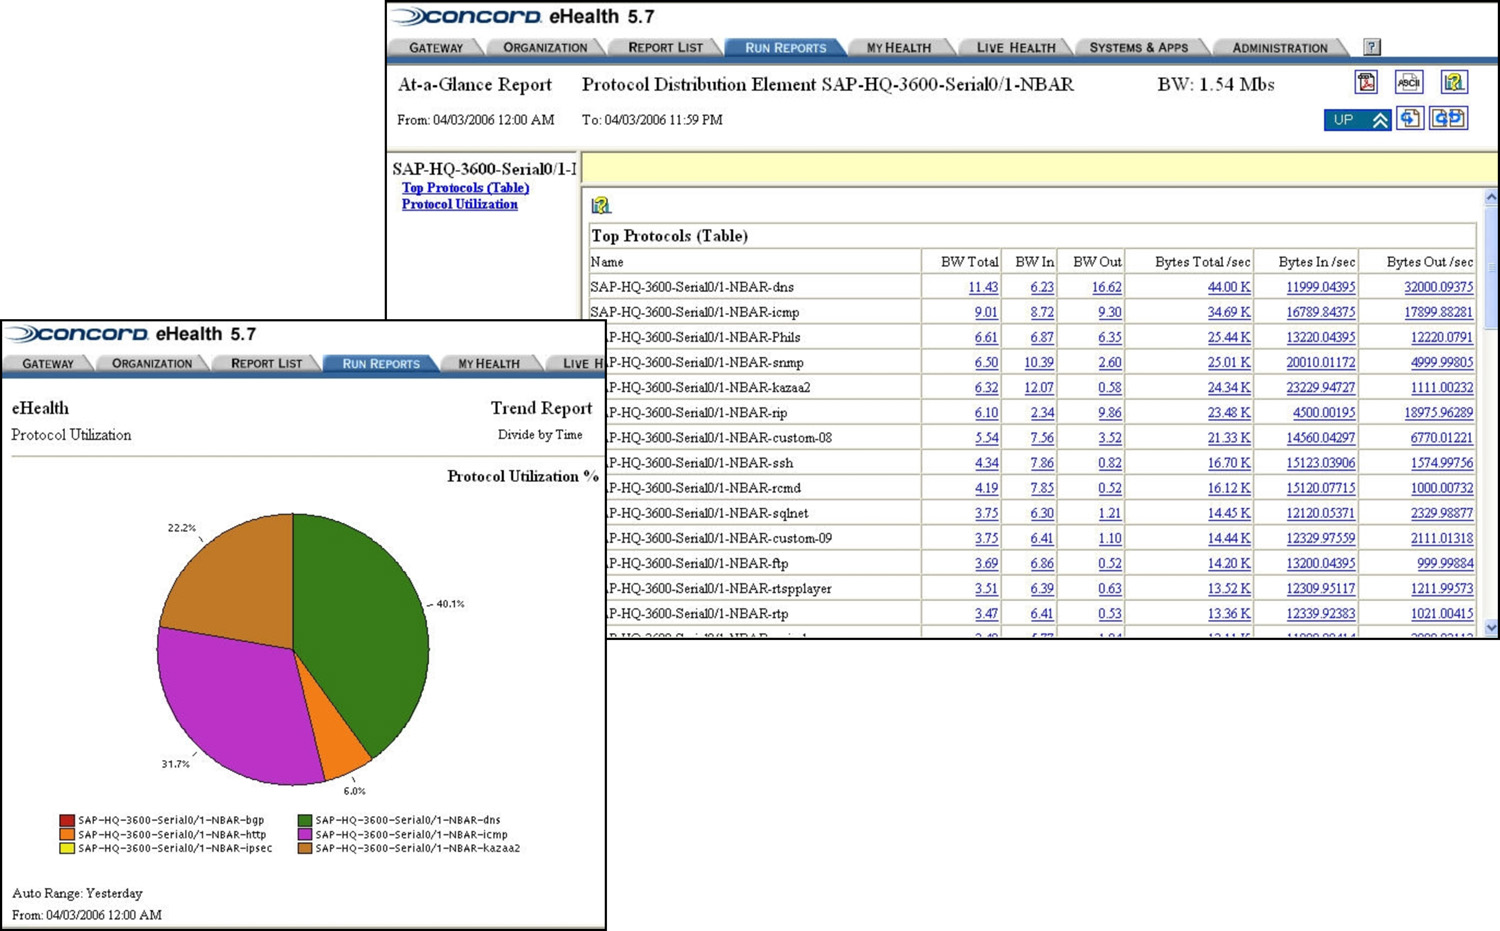
![]() Figure 12-13 shows a screen shot from the CA eHealth application that shows the top protocol distribution from the NBAR Discovery Protocol statistics.
Figure 12-13 shows a screen shot from the CA eHealth application that shows the top protocol distribution from the NBAR Discovery Protocol statistics.
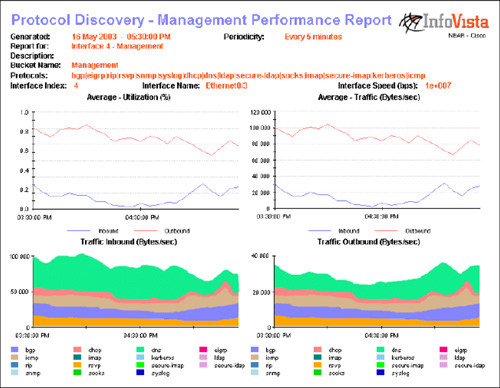
![]() Figure 12-14 shows a screen shot from the InfoVista VistaView application, displaying interface speed, traffic, utilization; and inbound and outbound traffic by application.
Figure 12-14 shows a screen shot from the InfoVista VistaView application, displaying interface speed, traffic, utilization; and inbound and outbound traffic by application.
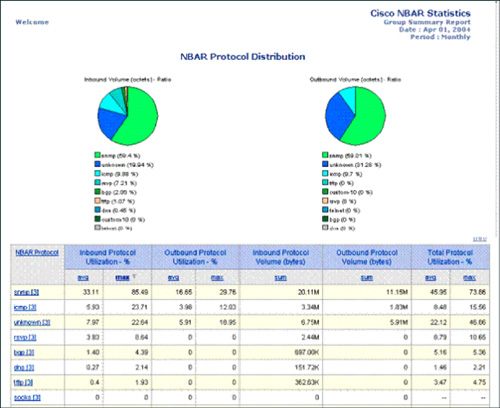
![]() Figure 12-15 provides a screen shot from the IBM Tivoli IT Netcool/Provisio application, showing the Top N protocol statistics. This information enables the network manager to identify the traffic mix on a specific link and understand which applications are consuming bandwidth.
Figure 12-15 provides a screen shot from the IBM Tivoli IT Netcool/Provisio application, showing the Top N protocol statistics. This information enables the network manager to identify the traffic mix on a specific link and understand which applications are consuming bandwidth.
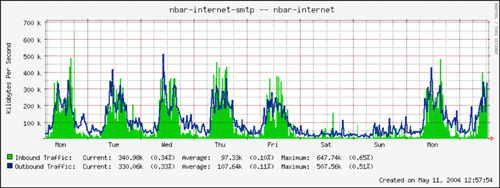
![]() Figure 12-16 shows an example screen shot using the Multi Router Traffic Grapher (MRTG) freeware application to graph NBAR Protocol Discovery statistics. The MRTG tool uses the Vermeer add-on to report on NBAR data collected through SNMP from routers.
Figure 12-16 shows an example screen shot using the Multi Router Traffic Grapher (MRTG) freeware application to graph NBAR Protocol Discovery statistics. The MRTG tool uses the Vermeer add-on to report on NBAR data collected through SNMP from routers.
NBAR and Cisco AutoQoS
![]() The Cisco IOS Software includes two features to automate the deployment of QoS in the network: AutoQoS VoIP and AutoQoS for the Enterprise. Both of these features use the NBAR traffic-classification functionality.
The Cisco IOS Software includes two features to automate the deployment of QoS in the network: AutoQoS VoIP and AutoQoS for the Enterprise. Both of these features use the NBAR traffic-classification functionality.
![]() The Cisco AutoQoS features on routers and switches provide a simple, automatic way to enable QoS configurations in conformance with Cisco best-practice recommendations. The router or switch creates configuration commands to perform such things as classifying and marking VoIP traffic and then applying a low-latency queuing (LLQ) strategy on WAN links for that traffic. The configuration created by AutoQoS becomes part of the normal configuration file and can therefore be edited if required.
The Cisco AutoQoS features on routers and switches provide a simple, automatic way to enable QoS configurations in conformance with Cisco best-practice recommendations. The router or switch creates configuration commands to perform such things as classifying and marking VoIP traffic and then applying a low-latency queuing (LLQ) strategy on WAN links for that traffic. The configuration created by AutoQoS becomes part of the normal configuration file and can therefore be edited if required.
 Cisco AutoQoS VoIP
![]() The Cisco AutoQoS VoIP feature is available with Cisco IOS Software Release 12.2(15)T and later releases and provides a way to simplify the implementation and provisioning of QoS for VoIP traffic.
The Cisco AutoQoS VoIP feature is available with Cisco IOS Software Release 12.2(15)T and later releases and provides a way to simplify the implementation and provisioning of QoS for VoIP traffic.
 Cisco AutoQoS for the Enterprise
![]() The Cisco AutoQoS for the Enterprise feature is available with Cisco IOS Software Release 12.3(11)T and later releases and helps automate the deployment of QoS in a general business environment, particularly for midsize companies and branch offices of larger companies. It expands on the functionality in the Cisco AutoQoS VoIP with support for QoS features required for voice, video, and data traffic.
The Cisco AutoQoS for the Enterprise feature is available with Cisco IOS Software Release 12.3(11)T and later releases and helps automate the deployment of QoS in a general business environment, particularly for midsize companies and branch offices of larger companies. It expands on the functionality in the Cisco AutoQoS VoIP with support for QoS features required for voice, video, and data traffic.
![]() This feature uses NBAR Protocol Discovery to gather traffic statistics, and then creates class maps and policy maps based on the detected traffic; suggested bandwidth settings per class are based on Cisco best practice recommendations.
This feature uses NBAR Protocol Discovery to gather traffic statistics, and then creates class maps and policy maps based on the detected traffic; suggested bandwidth settings per class are based on Cisco best practice recommendations.
![]() The Cisco AutoQoS for the Enterprise feature consists of a two-phase configuration process.
The Cisco AutoQoS for the Enterprise feature consists of a two-phase configuration process.
![]() In the first phase, Auto Discovery collects data and evaluates traffic in the network. The Auto Discovery phase is started by using the auto discovery qos [trust] interface configuration command.
In the first phase, Auto Discovery collects data and evaluates traffic in the network. The Auto Discovery phase is started by using the auto discovery qos [trust] interface configuration command.
![]() In untrusted mode (without the trust keyword), NBAR Protocol Discovery is used to detect and classify the applications on the network and perform statistical analysis on the network traffic.
In untrusted mode (without the trust keyword), NBAR Protocol Discovery is used to detect and classify the applications on the network and perform statistical analysis on the network traffic.
![]() In trusted mode (with the trust keyword), packets are classified based on DSCP values in the IP header. NBAR Protocol Discovery statistics are used to calculate the bandwidth and average or peak rate, which is passed to the template module.
In trusted mode (with the trust keyword), packets are classified based on DSCP values in the IP header. NBAR Protocol Discovery statistics are used to calculate the bandwidth and average or peak rate, which is passed to the template module.
![]() The data should be collected over a period of time (for several days to a week), to ensure a realistic traffic analysis.
The data should be collected over a period of time (for several days to a week), to ensure a realistic traffic analysis.
![]() The show auto discovery qos command displays the results of the data collected during the Auto Discovery phase. Example 12-3 shows an example output from the show auto discovery qos command, illustrating the results of the Cisco AutoQoS Discovery process.
The show auto discovery qos command displays the results of the data collected during the Auto Discovery phase. Example 12-3 shows an example output from the show auto discovery qos command, illustrating the results of the Cisco AutoQoS Discovery process.
router# show auto discovery qos
AutoQoS Discovery enabled for applications
Discovery up time: 2 days, 55 minutes
AutoQoS Class information:
Class VoIP:
Recommended Minimum Bandwidth: 517 Kbps/50% (PeakRate)
Detected applications and data:
Application/   AverageRate    PeakRate   Total
Protocol       (kbps/%)       (kbps/%)   (bytes)
rtp audio      76/7           517/50     703104
Class Interactive Video:
Recommended Minimum Bandwidth: 24 Kbps/2% (AverageRate)
Detected applications and data:
Application/   AverageRate    PeakRate   Total
Protocol       (kbps/%)       (kbps/%)   (bytes)
rtp video      24/2           5337/52    704574
Class Transactional:
Recommended Minimum Bandwidth: 0 Kbps/0% (AverageRate)
Detected applications and data:
Application/   AverageRate    PeakRate   Total
Protocol       (kbps/%)       (kbps/%)   (bytes)
citrix         36/3           74/7       30212
sqlnet         12/1           7/<1       1540
![]() In the second phase, the Cisco AutoQoS template generation and installation process generates templates from the data collected during the Auto Discovery phase and installs the templates on the configured interface. These templates are used as the basis for creating the class maps and policy maps for the network, with values for bandwidth and scheduling parameters based on the Auto Discovery statistics. The maps are then installed on the interface.
In the second phase, the Cisco AutoQoS template generation and installation process generates templates from the data collected during the Auto Discovery phase and installs the templates on the configured interface. These templates are used as the basis for creating the class maps and policy maps for the network, with values for bandwidth and scheduling parameters based on the Auto Discovery statistics. The maps are then installed on the interface.
![]() The Cisco AutoQoS template generation phase is started by using the auto qos interface configuration command. The generated class maps and policy maps should be reviewed by using the show auto qos command, and customized as necessary.
The Cisco AutoQoS template generation phase is started by using the auto qos interface configuration command. The generated class maps and policy maps should be reviewed by using the show auto qos command, and customized as necessary.
![]() By default, the NBAR mechanisms do not show unclassified traffic. As illustrated in Example 12-4, the show ip nbar unclassified-port-stats command returns an error message if the feature to analyze unclassified traffic is not enabled.
By default, the NBAR mechanisms do not show unclassified traffic. As illustrated in Example 12-4, the show ip nbar unclassified-port-stats command returns an error message if the feature to analyze unclassified traffic is not enabled.
router1# show ip nbar unclassified-port-stats
Port statistics for unclassified packets is not turned on.
![]() The debug ip nbar unclassified-port-stats command can be used to configure the router to begin tracking the ports on which packets arrive. The show ip nbar unclassified-port-stats command can then be used to verify the collected information; the output will display a histogram of the most commonly used ports.
The debug ip nbar unclassified-port-stats command can be used to configure the router to begin tracking the ports on which packets arrive. The show ip nbar unclassified-port-stats command can then be used to verify the collected information; the output will display a histogram of the most commonly used ports.
| Note |
|
![]() Example 12-5 shows example partial output of the show auto qos command, illustrating a suggested policy from the Cisco AutoQoS template-generation process.
Example 12-5 shows example partial output of the show auto qos command, illustrating a suggested policy from the Cisco AutoQoS template-generation process.



0 comments
Post a Comment