
Troubleshooting Performance Issues on Switches
![]() It is also important for a support engineer to be able to identify and possibly resolve the cause of an observed difference between the expected performance and the actual performance of the network as a whole, and of a specific device such as a LAN switch. This section provides information useful for diagnosing performance problems on Catalyst LAN switches. You will learn the Cisco IOS commands to perform the following tasks:
It is also important for a support engineer to be able to identify and possibly resolve the cause of an observed difference between the expected performance and the actual performance of the network as a whole, and of a specific device such as a LAN switch. This section provides information useful for diagnosing performance problems on Catalyst LAN switches. You will learn the Cisco IOS commands to perform the following tasks:
-
 Diagnose physical and data link layer problems on switch ports.
 - Analyze ternary content-addressable memory (TCAM) utilization on switches to determine the root cause of TCAM-allocation failures.
- Determine the root cause of high CPU usage on a switch.
Identifying Performance Issues on Switches
![]() A network performance problem can be defined as a situation where the observed traffic handling of the network does not meet certain expected standards. Because performance problems are defined in terms of “expected behavior,” which is subjective to a certain extent, they are considered hard to troubleshoot by many people. One would wonder if such a problem is caused by devices that are not performing according to predefined requirements or whether the problem is just a matter of mismatched perceptions and expectations. In other words, it has to become clear if the problem is at the business level or at the technical level. As you can imagine, cases involving something simply “not working” are straightforward. In those scenarios, all you need to ask yourself is if according to the requirements and design of the network, the application or functionality is expected/supposed to work (for that particular user and at that particular time). If the answer to that question is yes (and things are not working), the problem is clearly a technical one. The point is that performance problems are defined in terms of expectations and requirements by different entities:
A network performance problem can be defined as a situation where the observed traffic handling of the network does not meet certain expected standards. Because performance problems are defined in terms of “expected behavior,” which is subjective to a certain extent, they are considered hard to troubleshoot by many people. One would wonder if such a problem is caused by devices that are not performing according to predefined requirements or whether the problem is just a matter of mismatched perceptions and expectations. In other words, it has to become clear if the problem is at the business level or at the technical level. As you can imagine, cases involving something simply “not working” are straightforward. In those scenarios, all you need to ask yourself is if according to the requirements and design of the network, the application or functionality is expected/supposed to work (for that particular user and at that particular time). If the answer to that question is yes (and things are not working), the problem is clearly a technical one. The point is that performance problems are defined in terms of expectations and requirements by different entities:
- User expectations and requirements
- Business expectations and requirements
- Technical expectations and requirements
![]() As an example to illustrate the role of expectations in performance problems, suppose that a switch serves 20 users, each connected to a 100-Mbps port. There is a file server connected to the same switch on a 1-Gbps port. Users access the file server at different times, transferring files of various sizes. As long as not more than half of them are transferring files at the same time, they will experience transfer rates of up to the full 100 Mbps that is available to each user. Imagine that at the exact same moment, all users need to transfer a file from the server. Because the server has a total bandwidth of only 1 Gbps, the average transfer rate of the users will be 50 Mbps, while they are all transferring files. If users have come to expect transfer rates of 100 Mbps, they will perceive this as a performance problem; however, from a technical standpoint, the network performance is as expected. On the other hand, if one of the users never gets transfer rates higher than 50 Mbps, even if he is the only person transferring files, from a technical standpoint, this is a performance problem. Note that in the latter case the user might not even perceive this as a performance problem, because he has not come to expect transfer rates higher than 50 Mbps. In general, troubleshooting performance problems is a three-step process:
As an example to illustrate the role of expectations in performance problems, suppose that a switch serves 20 users, each connected to a 100-Mbps port. There is a file server connected to the same switch on a 1-Gbps port. Users access the file server at different times, transferring files of various sizes. As long as not more than half of them are transferring files at the same time, they will experience transfer rates of up to the full 100 Mbps that is available to each user. Imagine that at the exact same moment, all users need to transfer a file from the server. Because the server has a total bandwidth of only 1 Gbps, the average transfer rate of the users will be 50 Mbps, while they are all transferring files. If users have come to expect transfer rates of 100 Mbps, they will perceive this as a performance problem; however, from a technical standpoint, the network performance is as expected. On the other hand, if one of the users never gets transfer rates higher than 50 Mbps, even if he is the only person transferring files, from a technical standpoint, this is a performance problem. Note that in the latter case the user might not even perceive this as a performance problem, because he has not come to expect transfer rates higher than 50 Mbps. In general, troubleshooting performance problems is a three-step process:
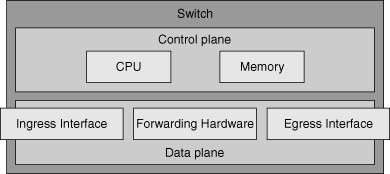
![]() Although there are differences between the hardware architectures among various Catalyst switch families, all switches include the following components:
Although there are differences between the hardware architectures among various Catalyst switch families, all switches include the following components:
- Interfaces: These are used to receive and transmit frames.
- Forwarding hardware: This consists of two elements: Hardware that implements the decision-making logic that is necessary to rewrite a frame and forward it to the correct interface; and a backplane to carry frames from the ingress interface to the egress interface.
- Control plane hardware: These execute the processes that are part of the operating system.
![]() Traffic flowing through a switch enters on an ingress interface, is forwarded by the forwarding hardware, and leaves through the egress interface. The performance of these components directly influences switch overall performance. The control plane CPU and memory are not involved in switching traffic. Therefore, the control plane hardware does not have a direct impact on switch performance. However, the control plane is responsible for updating the information in the forwarding hardware. Therefore, the control plane has an indirect effect on the forwarding capability of the platform. If the control plane is consistently running at a high load, this could eventually affect the forwarding behavior of the device. Moreover, the control plane hardware handles any traffic that cannot be handled by the forwarding hardware. A high load on the control plane hardware could therefore be an indication that the forwarding hardware has reached its maximum capacity or is not handling traffic as it should. As Figure 7-10 shows, components of both the control plane (memory and CPU) and the data plane (ingress interface, forwarding hardware, and the egress interface) contribute to the overall switch performance.
Traffic flowing through a switch enters on an ingress interface, is forwarded by the forwarding hardware, and leaves through the egress interface. The performance of these components directly influences switch overall performance. The control plane CPU and memory are not involved in switching traffic. Therefore, the control plane hardware does not have a direct impact on switch performance. However, the control plane is responsible for updating the information in the forwarding hardware. Therefore, the control plane has an indirect effect on the forwarding capability of the platform. If the control plane is consistently running at a high load, this could eventually affect the forwarding behavior of the device. Moreover, the control plane hardware handles any traffic that cannot be handled by the forwarding hardware. A high load on the control plane hardware could therefore be an indication that the forwarding hardware has reached its maximum capacity or is not handling traffic as it should. As Figure 7-10 shows, components of both the control plane (memory and CPU) and the data plane (ingress interface, forwarding hardware, and the egress interface) contribute to the overall switch performance.
Troubleshooting Switch Interface Performance Problems
![]() In case of suspected performance problems, interfaces are among the first to be inspected. If the physical cabling is bad, this will cause packet loss, and packet loss can cause various performance problems. TCP-based applications can survive a certain amount of packet loss because that protocol has retransmission capabilities that allow it to recover lost packets. However, TCP also has flow control mechanisms. TCP slows down its transmission rate based on packet loss, because the most common cause of packet loss is (temporary) congestion. Consequently, packet loss caused by bad cables or interfaces usually results in slow TCP-based connections across an interface. UDP does not have inherent retransmission mechanisms, and therefore the result of packet loss on UDP-based applications depends on the way that the application deals with packet loss. For real-time traffic, such as voice or video, a high percentage of packet loss has a direct and negative affect on the quality of the voice or video communications.
In case of suspected performance problems, interfaces are among the first to be inspected. If the physical cabling is bad, this will cause packet loss, and packet loss can cause various performance problems. TCP-based applications can survive a certain amount of packet loss because that protocol has retransmission capabilities that allow it to recover lost packets. However, TCP also has flow control mechanisms. TCP slows down its transmission rate based on packet loss, because the most common cause of packet loss is (temporary) congestion. Consequently, packet loss caused by bad cables or interfaces usually results in slow TCP-based connections across an interface. UDP does not have inherent retransmission mechanisms, and therefore the result of packet loss on UDP-based applications depends on the way that the application deals with packet loss. For real-time traffic, such as voice or video, a high percentage of packet loss has a direct and negative affect on the quality of the voice or video communications.
![]() When you find indications of packet loss on a switch, the first place to look is usually the output of the show interface command. This output shows packet statistics including various error counters. On switches, two additional command options are supported that are not available on routers:
When you find indications of packet loss on a switch, the first place to look is usually the output of the show interface command. This output shows packet statistics including various error counters. On switches, two additional command options are supported that are not available on routers:
- show interfaces interface counters: This command displays the total numbers of input and output unicast, multicast, and broadcast packets and the total input and output byte counts.
- show interfaces interface counters errors: This command displays the error statistics for each interface. Table 7-2 lists the parameters reported by this command output. Table 7-2: The Parameters Reported by show interfaces interface counters errors Reported ParameterDescriptionAlign-ErrThis is the number of frames with alignment errors, which are frames that do not end with an even number of octets and have a bad cyclic redundancy check (CRC), received on the port. These usually indicate a physical problem, for example, cabling, a bad port, or a bad network interface card (NIC), but can also indicate a duplex mismatch. When the cable is first connected to the port, some of these errors can occur. Also, if there is a hub connected to the port, collisions between other devices on the hub can cause these errors.FCS-ErrThe number of valid size frames with frame check sequence (FCS) errors, but no framing errors. This is typically a physical issue (for example, cabling, a bad port, or a bad NIC), but can also indicate a duplex mismatch.Xmit-Err and Rcv-ErrThis indicates that the internal port transmit (Tx) or receive (Rx) buffers are full. A common cause of Xmit-Err is traffic from a high-bandwidth link that is switched to a lower-bandwidth link, or traffic from multiple inbound links that is switched to a single outbound link. For example, if a large amount of bursty traffic comes in on a Gigabit port and is switched out to a 100-Mbps port, the Xmit-Err field might increment on the 100-Mbps port. This is because the port output buffer is overwhelmed by the excess traffic because of the speed mismatch between the incoming and outgoing bandwidths.UndersizeThe frames received that are smaller than the minimum IEEE 802.3 frame size of 64 bytes long (which excludes framing bits, but includes FCS octets) that are otherwise well formed, so it has a valid CRC. Check the device that sends out these frames.Single-ColThe number of times one collision occurs before the port transmits a frame to the media successfully. Collisions are normal for ports operating in half-duplex mode, but should not be seen on ports operating in full-duplex mode. If collisions are increasing dramatically, this indicates a highly utilized link or possibly a duplex mismatch with the attached device.Multi-ColThis is the number of times multiple collisions occur before the port transmits a frame to the media successfully. Collisions are normal for ports operating in half-duplex mode, but should not be seen on ports operating in full-duplex mode. If collisions increase dramatically, this indicates a highly utilized link or possibly a duplex mismatch with the attached device.Late-ColThis is the number of times that a collision is detected on a particular port late in the transmission process. For a 10-Mbps port, this is later than 512 bit-times into the transmission of a packet. Five hundred and twelve bit-times corresponds to 51.2 microseconds on a 10-Mbps system. This error can indicate a duplex mismatch among other things. For the duplex mismatch scenario, the late collision is seen on the half-duplex side. As the half-duplex side transmits, the full-duplex side does not wait its turn and transmits simultaneously, which causes a late collision. Late collisions can also indicate an Ethernet cable or segment that is too long. Collisions should not be seen on ports configured as full-duplex.Excess-ColThis is a count of frames transmitted on a particular port, which fail due to excessive collisions. An excessive collision occurs when a packet has a collision 16 times in a row. The packet is then dropped. Excessive collisions are typically an indication that the load on the segment needs to be split across multiple segments, but can also point to a duplex mismatch with the attached device. Collisions should not be seen on ports configured as full duplex.Carri-SenThis occurs every time an Ethernet controller wants to send data on a half-duplex connection. The controller senses the wire and checks whether it is not busy before transmitting. This is normal on a half-duplex Ethernet segment.RuntsThe frames received are smaller than the minimum IEEE 802.3 frame size (64 bytes for Ethernet) and have a bad CRC. This can be caused by a duplex mismatch and physical problems, such as a bad cable, port, or NIC on the attached device.GiantsThese are frames that exceed the maximum IEEE 802.3 frame size (1518 bytes for nonjumbo Ethernet), and have a bad FCS. Try to find the offending device and remove it from the network. In many cases, it is the result of a bad NIC.
![]() It is important to relate any error statistics to the total number of received frames in case of receive errors (such as FCS errors) or the total number of transmitted frames in case of transmit errors (such as collisions). For example, in Example 7-18, you can see that there are 12618 FCS errors on a total of 499128 + 4305 + 0 = 503433 received frames, which translates to 2.5 percent of the received traffic on the interface. In general, more than one FCS error in a million frames (0.0001 percent) is reason to investigate.
It is important to relate any error statistics to the total number of received frames in case of receive errors (such as FCS errors) or the total number of transmitted frames in case of transmit errors (such as collisions). For example, in Example 7-18, you can see that there are 12618 FCS errors on a total of 499128 + 4305 + 0 = 503433 received frames, which translates to 2.5 percent of the received traffic on the interface. In general, more than one FCS error in a million frames (0.0001 percent) is reason to investigate.
Port InOctets InUcastPkts InMcastPkts InBcastPkts
Fa0/1 647140108 499128 4305 0
Port OutOctets OutUcastPkts OutMcastPkts OutBcastPkts
Fa0/1 28533484 319996 52 3
ASW1# show interfaces FastEthernet 0/1 counters errors
Port Align-Err FCS-Err Xmit-Err Rcv-Err UnderSize OutDiscards
Fa0/1 0 12618 0 12662 0 0
Port Single-Col Multi-Col Late-Col Excess-Col Carri-Sen Runts Giants
Fa0/1 0 0 0 0 0 0 44
![]() A common cause for interface errors is a mismatched duplex mode between two ends of an Ethernet link. In many Ethernet-based networks, point-to-point connections are now the norm and the use of hubs and the associated half-duplex operation is not common. This means that most modern Ethernet links operate in full-duplex mode, and although collisions were seen as normal for an Ethernet link in the past, today, collisions often indicate that duplex negotiation has failed and the link is not operating in the correct duplex mode. The IEEE 802.3ab Gigabit Ethernet standard mandates the use of autonegotiation for speed and duplex. In addition, although it is not strictly mandatory, practically all Fast Ethernet NICs also use auto negotiation by default. The use of autonegotiation for speed and duplex is the current recommended practice at the network edge; however, if duplex negotiation fails for some reason, it might be necessary to set the speed and duplex manually on both ends. Typically, in this situation the duplex mode is set to full duplex on both ends of the connection; if that doesn’t work, setting half duplex on both ends of a connection is naturally preferred over a duplex mismatch!
A common cause for interface errors is a mismatched duplex mode between two ends of an Ethernet link. In many Ethernet-based networks, point-to-point connections are now the norm and the use of hubs and the associated half-duplex operation is not common. This means that most modern Ethernet links operate in full-duplex mode, and although collisions were seen as normal for an Ethernet link in the past, today, collisions often indicate that duplex negotiation has failed and the link is not operating in the correct duplex mode. The IEEE 802.3ab Gigabit Ethernet standard mandates the use of autonegotiation for speed and duplex. In addition, although it is not strictly mandatory, practically all Fast Ethernet NICs also use auto negotiation by default. The use of autonegotiation for speed and duplex is the current recommended practice at the network edge; however, if duplex negotiation fails for some reason, it might be necessary to set the speed and duplex manually on both ends. Typically, in this situation the duplex mode is set to full duplex on both ends of the connection; if that doesn’t work, setting half duplex on both ends of a connection is naturally preferred over a duplex mismatch!
Switch Port/Interface Issues
![]() Some problems are caused by physical issues related to cabling or switch ports. Checking the cable and both sides of a given connection, particularly when you are using a bottom-up approach, is strongly advised. The LEDs on switches can provide valuable information. With the information gathered from the LEDs, you can determine what corrective action might be needed. Common interface and wiring problems and their corresponding remedies include the following:
Some problems are caused by physical issues related to cabling or switch ports. Checking the cable and both sides of a given connection, particularly when you are using a bottom-up approach, is strongly advised. The LEDs on switches can provide valuable information. With the information gathered from the LEDs, you can determine what corrective action might be needed. Common interface and wiring problems and their corresponding remedies include the following:
- No cable connected: Connect the cable from the switch to a known good device.
- Wrong port: Make sure that both ends of the cable are plugged into the correct ports.
- Device has no power: Ensure that both devices have power.
- Wrong cable type: Verify that the correct type of cable is being used.
- Bad cable: Swap the suspect cable with a known good cable. Look for broken or missing pins on connectors.
- Loose connections: Check for loose connections. Sometimes a cable appears to be seated in the jack, but it is not. Unplug the cable and reinsert it.
- Patch panels: Eliminate faulty patch panel connections. Bypass the patch panel if possible to rule it out as the problem.
- Media converters: Eliminate faulty media converters. Bypass the media converter, if possible, to rule it out as the problem.
- Bad or wrong gigabit interface converter (GBIC): Swap the suspect GBIC with a known good GBIC. Verify hardware and software support for the GBIC.
![]() Some other issues are related to configuration problems that can result in performance degradation. The most common ones are duplex negotiations, speed negotiation, and EtherChannel configurations.
Some other issues are related to configuration problems that can result in performance degradation. The most common ones are duplex negotiations, speed negotiation, and EtherChannel configurations.
Troubleshooting Example: Duplex Problem
![]() This example is based on the network diagram shown in Figure 7-11. The user on PC1 has complained that transferring large files to SRV1 takes hours. First, you need to verify whether this is really a technical problem or if the performance is within expected boundaries. Assume that after determining the traffic path between the client and the server, the maximum throughput that this user can expect is 100 Mbps. Transfer of 1 GB (gigabyte) of data at the rate of 100 Mbps takes approximately 80 seconds, not taking any overhead into account. However, it is clear that even with added overhead the transfer should still only take minutes, not hours. There can be two potential explanations: Either congestion on the network causes this user to get only a small portion of the available bandwidth (100 Mbps), or this is caused by underperforming hardware or software on the client, network, or server. When you verify the load on the links in the path using the performance management system, you notice that the average load has not been higher than 50 percent over the past few hours. Ruling out congestion as the cause, you could run comparative tests from several different points in the network, but decide to first verify the physical path between the client and server to see whether the network is causing this problem.
This example is based on the network diagram shown in Figure 7-11. The user on PC1 has complained that transferring large files to SRV1 takes hours. First, you need to verify whether this is really a technical problem or if the performance is within expected boundaries. Assume that after determining the traffic path between the client and the server, the maximum throughput that this user can expect is 100 Mbps. Transfer of 1 GB (gigabyte) of data at the rate of 100 Mbps takes approximately 80 seconds, not taking any overhead into account. However, it is clear that even with added overhead the transfer should still only take minutes, not hours. There can be two potential explanations: Either congestion on the network causes this user to get only a small portion of the available bandwidth (100 Mbps), or this is caused by underperforming hardware or software on the client, network, or server. When you verify the load on the links in the path using the performance management system, you notice that the average load has not been higher than 50 percent over the past few hours. Ruling out congestion as the cause, you could run comparative tests from several different points in the network, but decide to first verify the physical path between the client and server to see whether the network is causing this problem.


![]() As shown in Example 7-19, interface FastEthernet 0/2 on ASW1, which leads to the client, does not show a significant number of errors. However, when you verify interface FastEthernet 0/1, which leads to CSW1, you notice a high percentage of FCS errors. Although FCS errors can have various other causes, such as bad cabling or bad interface hardware, they are also a symptom associated with a duplex mismatch. If one side of an Ethernet link is running in full-duplex mode and the other side is running in half-duplex mode, on the side of the connection that is running in full-duplex mode, you will see FCS errors rapidly increasing. This happens because a NIC that is operating in full-duplex mode will not listen for carrier, and it simply transmits whenever it has a frame to send. If the other side happens to be transmitting at that same moment, it will sense the transmission coming in, detect the collision, and will immediately stop its own transmission. This, in turn, causes only a partial frame to be received by the full-duplex side of the connection, which is recorded as an FCS error.
As shown in Example 7-19, interface FastEthernet 0/2 on ASW1, which leads to the client, does not show a significant number of errors. However, when you verify interface FastEthernet 0/1, which leads to CSW1, you notice a high percentage of FCS errors. Although FCS errors can have various other causes, such as bad cabling or bad interface hardware, they are also a symptom associated with a duplex mismatch. If one side of an Ethernet link is running in full-duplex mode and the other side is running in half-duplex mode, on the side of the connection that is running in full-duplex mode, you will see FCS errors rapidly increasing. This happens because a NIC that is operating in full-duplex mode will not listen for carrier, and it simply transmits whenever it has a frame to send. If the other side happens to be transmitting at that same moment, it will sense the transmission coming in, detect the collision, and will immediately stop its own transmission. This, in turn, causes only a partial frame to be received by the full-duplex side of the connection, which is recorded as an FCS error.
Full-duplex, 100Mb/s, media type is 10/100Base TX
ASW1# show interfaces FastEthernet 0/1 counters errors
Port Align-Err FCS-Err Xmit-Err Rcv-Err UnderSize OutDiscards
Fa0/1 0 12618 0 12662 0 0
Port Single-Col Multi-Col Late-Col Excess-Col Carri-Sen Runts Giants
Fa0/1 0 0 0 0 0 0 44
![]() When you connect to switch CSW1 and verify the same connection on that side. As Example 7-20 shows, a high numbers of collisions occur, specifically late collisions. This is an important clue because collisions only happen on links that run in half-duplex mode. The fact that you see high numbers of collisions on this side and no collisions on the other side tells you that this side is running in half-duplex mode and the other side in full-duplex mode. Even if you did not have access to switch ASW1, the counters for interface FastEthernet 0/1 on CSW1 strongly suggest a duplex problem. If this link is supposed to run in half-duplex mode, a certain number of collisions is considered normal. However, late collisions should not happen and always indicate a problem. The reason that you see late collisions on the half-duplex side of a duplex mismatch is the same behavior that causes the FCS errors on the full-duplex side. In normal half-duplex Ethernet operation, collisions will only happen during the first 64 bytes of a transmission. In case of a duplex mismatch, however, the full-duplex side transmits frames without listening for carrier, and this might be at any point during a transmission by the half-duplex side.
When you connect to switch CSW1 and verify the same connection on that side. As Example 7-20 shows, a high numbers of collisions occur, specifically late collisions. This is an important clue because collisions only happen on links that run in half-duplex mode. The fact that you see high numbers of collisions on this side and no collisions on the other side tells you that this side is running in half-duplex mode and the other side in full-duplex mode. Even if you did not have access to switch ASW1, the counters for interface FastEthernet 0/1 on CSW1 strongly suggest a duplex problem. If this link is supposed to run in half-duplex mode, a certain number of collisions is considered normal. However, late collisions should not happen and always indicate a problem. The reason that you see late collisions on the half-duplex side of a duplex mismatch is the same behavior that causes the FCS errors on the full-duplex side. In normal half-duplex Ethernet operation, collisions will only happen during the first 64 bytes of a transmission. In case of a duplex mismatch, however, the full-duplex side transmits frames without listening for carrier, and this might be at any point during a transmission by the half-duplex side.
Full-duplex, 100Mb/s, media type is 10/100Base TX
CSW1# show interfaces FastEthernet 0/1 counters errors
Port Align-Err FCS-Err Xmit-Err Rcv-Err UnderSize OutDiscards
Fa0/1 0 0 0 0 0 0
Port Single-Col Multi-Col Late-Col Excess-Col Carri-Sen Runts Giants
Fa0/1 664 124 12697 0 0 0 44
![]() After considering all the symptoms, you conclude that the duplex mismatch is likely the cause of the performance problem. You verify the settings on both switches, and it turns out that somehow a mismatched manual speed and duplex configuration has caused this mismatch. You configure both sides for autonegotiation, clear the counters, and confirm that the negotiation results in full duplex. Together with the user, you perform a test by transferring some files. The transfers now only take a few minutes. You verify on the switches that the FCS and collision counters do not increase. Finally, you make a backup of the configuration and document the change.
After considering all the symptoms, you conclude that the duplex mismatch is likely the cause of the performance problem. You verify the settings on both switches, and it turns out that somehow a mismatched manual speed and duplex configuration has caused this mismatch. You configure both sides for autonegotiation, clear the counters, and confirm that the negotiation results in full duplex. Together with the user, you perform a test by transferring some files. The transfers now only take a few minutes. You verify on the switches that the FCS and collision counters do not increase. Finally, you make a backup of the configuration and document the change.
Auto-MDIX
![]() Automatic medium-dependent interface crossover (auto-MDIX) is a feature supported on many switches and NICs. This feature automatically detects the required cable connection type (straight-through or crossover) for a connection. As long as one of the two sides of a connection supports auto-MDIX, you can use a crossover or a straight-through Ethernet cable and the connection will work. However, this feature depends on the speed and duplex autonegotiation feature, and disabling speed and duplex negotiation will also disable auto-MDIX for an interface. The default setting for auto-MDIX was changed from disabled to enabled starting from Cisco IOS Software Release 12.2(20)SE. Therefore, auto-MDIX does not specifically have to be enabled on most switches. However, if you have a switch that supports auto-MDIX, but is running older software, you can enable this feature manually using the mdix auto command (see Example 7-21). Be aware that this command enables auto-MDIX only if speed and duplex autonegotiation are enabled, too.
Automatic medium-dependent interface crossover (auto-MDIX) is a feature supported on many switches and NICs. This feature automatically detects the required cable connection type (straight-through or crossover) for a connection. As long as one of the two sides of a connection supports auto-MDIX, you can use a crossover or a straight-through Ethernet cable and the connection will work. However, this feature depends on the speed and duplex autonegotiation feature, and disabling speed and duplex negotiation will also disable auto-MDIX for an interface. The default setting for auto-MDIX was changed from disabled to enabled starting from Cisco IOS Software Release 12.2(20)SE. Therefore, auto-MDIX does not specifically have to be enabled on most switches. However, if you have a switch that supports auto-MDIX, but is running older software, you can enable this feature manually using the mdix auto command (see Example 7-21). Be aware that this command enables auto-MDIX only if speed and duplex autonegotiation are enabled, too.
Switch(config-if)# shutdown
Switch(config-if)# speed auto
Switch(config-if)# duplex auto
Switch(config-if)# mdix auto
Switch(config-if)# no shutdown
Switch(config-if)# end
Switch#
!
![]() To verify the status of auto-MDIX, speed, and duplex for an interface, you can use the show interface transceiver properties command, as demonstrated in Example 7-22.
To verify the status of auto-MDIX, speed, and duplex for an interface, you can use the show interface transceiver properties command, as demonstrated in Example 7-22.
Diagnostic Monitoring is not implemented
Name : Fa0/10
Administrative Speed: auto
Administrative Duplex: auto
Administrative Auto-MDIX: on
Administrative Power Inline: N/A
Operational Speed: 100
Operational Duplex: full
Operational Auto-MDIX: on
Media Type: 10/100BaseTX
The Forwarding Hardware
![]() After considering the impact of ingress and egress interfaces on switch performance, this topic looks at the components of the forwarding hardware involved in switching the frames from the ingress interface to the egress interface and the impact that they have on the performance of the switch. Essentially, the forwarding hardware always consists of two major components:
After considering the impact of ingress and egress interfaces on switch performance, this topic looks at the components of the forwarding hardware involved in switching the frames from the ingress interface to the egress interface and the impact that they have on the performance of the switch. Essentially, the forwarding hardware always consists of two major components:
- Backplane: The backplane carries traffic between interfaces. There are many different types of backplane architectures. The hardware of a switch backplane can be based on a ring, bus, shared memory, crossbar fabric, or a combination of these elements.
- Decision-making logic: For each incoming frame, the decision-making logic makes the decision to either forward the frame or discard it; this is also called performing Layer 2 and Layer 3 switching actions. For forwarded frames, the decision-making logic provides the information necessary to rewrite and forward the frame and may take other actions such as the processing of access lists or quality of service (QoS) features.
![]() The impact of the backplane on switch performance is limited. The backplane of a switch is designed for very high switching capacity. In most cases, the limiting factor in throughput on a switched network is the capacity of the links between the devices, not the capacity of the backplanes of the switches. Still, in certain specific cases the backplane might become a bottleneck and needs to be taken into account to correctly compute the maximum total throughput between a number of devices. For instance, a number of ports might share a certain amount of bandwidth to the switch backplane. If that shared bandwidth is lower than the total bandwidth of all the ports combined, the ports are oversubscribed. This situation is similar to the situation where you have an access switch with 24 Fast Ethernet ports and a single 1-Gbps uplink. The total aggregate bandwidth for the 24 Fast Ethernet ports is 2.4 Gbps, and if they all need to send at full speed across the uplink, congestion will occur and frames will be dropped. However, in most cases, the 24 ports will not be transmitting at full speed at the same time, and their combined load will easily fit the 1-Gbps uplink.
The impact of the backplane on switch performance is limited. The backplane of a switch is designed for very high switching capacity. In most cases, the limiting factor in throughput on a switched network is the capacity of the links between the devices, not the capacity of the backplanes of the switches. Still, in certain specific cases the backplane might become a bottleneck and needs to be taken into account to correctly compute the maximum total throughput between a number of devices. For instance, a number of ports might share a certain amount of bandwidth to the switch backplane. If that shared bandwidth is lower than the total bandwidth of all the ports combined, the ports are oversubscribed. This situation is similar to the situation where you have an access switch with 24 Fast Ethernet ports and a single 1-Gbps uplink. The total aggregate bandwidth for the 24 Fast Ethernet ports is 2.4 Gbps, and if they all need to send at full speed across the uplink, congestion will occur and frames will be dropped. However, in most cases, the 24 ports will not be transmitting at full speed at the same time, and their combined load will easily fit the 1-Gbps uplink.
Troubleshooting TCAM Problems
![]() The decision-making logic of a switch has a significant impact on its performance. The decision-making logic consists of specialized high performance lookup memory, the ternary content-addressable memory (TCAM). The control plane information necessary to make forwarding decisions, such as MAC address tables, routing information, access list information, and QoS information, build the content of the TCAM. The TCAM then takes all the necessary forwarding decisions for a frame at speeds that are high enough and it utilizes full capacity of the switch backplane. TCAM’s decision-making process does not impede or limit the forwarding performance of the switch. However, if for some reason frames cannot be forwarded by the TCAM, they will be handed off (punted) to the CPU for processing. Because the CPU is also used to execute the control plane processes, it can only forward traffic at certain rate. Consequently, if a large amount of traffic is punted to the CPU, the throughput for the traffic concerned will descend, and an adverse affect on the control plane processes will also be observed.
The decision-making logic of a switch has a significant impact on its performance. The decision-making logic consists of specialized high performance lookup memory, the ternary content-addressable memory (TCAM). The control plane information necessary to make forwarding decisions, such as MAC address tables, routing information, access list information, and QoS information, build the content of the TCAM. The TCAM then takes all the necessary forwarding decisions for a frame at speeds that are high enough and it utilizes full capacity of the switch backplane. TCAM’s decision-making process does not impede or limit the forwarding performance of the switch. However, if for some reason frames cannot be forwarded by the TCAM, they will be handed off (punted) to the CPU for processing. Because the CPU is also used to execute the control plane processes, it can only forward traffic at certain rate. Consequently, if a large amount of traffic is punted to the CPU, the throughput for the traffic concerned will descend, and an adverse affect on the control plane processes will also be observed.
![]() TCAM will punt any frames to the CPU for forwarding that it cannot forward itself. This does not include frames that are explicitly dropped (for example, by an access list) because the inbound port is in the spanning-tree Blocking state or because a VLAN is not allowed on a trunk. Traffic might be punted or handled by the CPU for many reasons, some main examples of which are as follows:
TCAM will punt any frames to the CPU for forwarding that it cannot forward itself. This does not include frames that are explicitly dropped (for example, by an access list) because the inbound port is in the spanning-tree Blocking state or because a VLAN is not allowed on a trunk. Traffic might be punted or handled by the CPU for many reasons, some main examples of which are as follows:
- Packets destined for any of the switch IP addresses. Examples of such packets include Telnet, Secure Shell (SSH), or Simple Network Management Protocol (SNMP) packets destined for one of the switch IP addresses.
- Multicasts and broadcasts from control plane protocols such as the Spanning Tree Protocol (STP) or routing protocols. Routing protocol broadcasts and multicasts are processed by the CPU in addition to being flooded to all ports within the VLAN that the frame was received in, as usual.
- Packets that cannot be forwarded by the TCAM because a feature is not supported in hardware. For example, generic routing encapsulation (GRE) tunnels can be configured on a Catalyst 3560 switch, but because this is not a TCAM-supported feature on this switch, the GRE packets will be punted.
- Packets that cannot be forwarded in hardware because the TCAM could not hold the necessary information. The TCAM has a limited capacity, and when entries cannot be programmed into the TCAM, the packets associated to those entries will have to be punted to the CPU to be forwarded. If you have too many IP routes or too many access list entries, some of them might not be installed in the TCAM, and associated packets cannot be forwarded in hardware. This item is the most likely to cause performance problems on a switch. The CPU always handles control plane packets in software, and the volume of this type is relatively low. However, the volume of traffic that flows through a switch is substantial, and if even a fraction of this traffic is handed off to the CPU, it will quickly cause performance degradation. The traffic itself might be dropped or forwarded slowly. Furthermore, the control plane processes will suffer because the packet-switching process consumes a large share of the available CPU cycles.
| Note |
|
![]() To discover how close the current TCAM utilization is to the platform limits, use the show platform tcam utilization command. The TCAM is carved into separate areas that contain entries associated with a particular usage. Each of these areas has its associated limits. On the Catalyst 3560 and 3750 series switches, the allocation of TCAM space for specific uses is based on a switch database manager (SDM) template. Templates other than the default can be selected to change the allocation of TCAM resources to better fit the role of the switch in the network. For more information, consult the SDM section of the configuration guide for the Catalyst 3560 or 3750 series switches.
To discover how close the current TCAM utilization is to the platform limits, use the show platform tcam utilization command. The TCAM is carved into separate areas that contain entries associated with a particular usage. Each of these areas has its associated limits. On the Catalyst 3560 and 3750 series switches, the allocation of TCAM space for specific uses is based on a switch database manager (SDM) template. Templates other than the default can be selected to change the allocation of TCAM resources to better fit the role of the switch in the network. For more information, consult the SDM section of the configuration guide for the Catalyst 3560 or 3750 series switches.
![]() Example 7-23 shows the maximum number of masks and values that can be assigned to IP Version 4 not directly connected routes are 272 and 2176, respectively. Currently, 30 masks and 175 values are in use. This means that this switch is still far from reaching its maximum capacity. As the output of the show command states (on the bottom), the exact algorithm to allocate TCAM entries for a particular feature is complex and you cannot simply tell how many IPv4 routes can be added to the routing table before the TCAM will reach its maximum. However, when you see the values in the Used column getting close to the values in the Max column, you might start experiencing extra load on the CPU because failed allocation of TCAM resources.
Example 7-23 shows the maximum number of masks and values that can be assigned to IP Version 4 not directly connected routes are 272 and 2176, respectively. Currently, 30 masks and 175 values are in use. This means that this switch is still far from reaching its maximum capacity. As the output of the show command states (on the bottom), the exact algorithm to allocate TCAM entries for a particular feature is complex and you cannot simply tell how many IPv4 routes can be added to the routing table before the TCAM will reach its maximum. However, when you see the values in the Used column getting close to the values in the Max column, you might start experiencing extra load on the CPU because failed allocation of TCAM resources.
CAM Utilization for ASIC# 0 Max Used
Masks/Values Masks/Values
Unicast mac addresses: 784/6272 23/99
IPv4 IGMP groups + multicast routes: 144/1152 6/26
IPv4 unicast directly-connected routes: 784/6272 23/99
IPv4 unicast indirectly-connected routes: 272/2176 30/175
IPv4 policy based routing aces: 0/0 30/175
IPv4 qos aces: 768/768 260/260
IPv4 security aces: 1024/1024 27/27
Note: Allocation of TCAM entries per feature uses
A complex algorithm. The above information is meant
To provide an abstract view of the current TCAM utilization
![]() For some types of TCAM entries, it is possible to see whether any TCAM-allocation failures have occurred. For example, the output of the show platform ip unicast counts command, displayed in Example 7-24, shows if any TCAM-allocation failures were experienced for IP Version 4 prefixes. In general, TCAM-allocation failures are rare because switches have more than enough TCAM capacity for the roles that they are designed and positioned for. However, all networks are different, so be aware of the fact that TCAM-allocation failures can be a possible cause of performance problems. Even though it is more of a security-related topic, it is still related to this discussion to caution you about MAC attacks which fill up the CAM/TCAM, leading to performance degradation.
For some types of TCAM entries, it is possible to see whether any TCAM-allocation failures have occurred. For example, the output of the show platform ip unicast counts command, displayed in Example 7-24, shows if any TCAM-allocation failures were experienced for IP Version 4 prefixes. In general, TCAM-allocation failures are rare because switches have more than enough TCAM capacity for the roles that they are designed and positioned for. However, all networks are different, so be aware of the fact that TCAM-allocation failures can be a possible cause of performance problems. Even though it is more of a security-related topic, it is still related to this discussion to caution you about MAC attacks which fill up the CAM/TCAM, leading to performance degradation.
# of HL3U fibs 141
# of HL3U adjs 9
# of HL3U mpaths 2
# of HL3U covering-fibs 0
# of HL3U fibs with adj failures 0
Fibs of Prefix length 0, with TCAM fails: 0
Fibs of Prefix length 1, with TCAM fails: 0
Fibs of Prefix length 2, with TCAM fails: 0
Fibs of Prefix length 3, with TCAM fails: 0
Fibs of Prefix length 4, with TCAM fails: 0
Fibs of Prefix length 5, with TCAM fails: 0
Fibs of Prefix length 6, with TCAM fails: 0
<... further output omitted ...>
![]() Another way to spot potential TCAM-allocation failures is by observing traffic being punted to the CPU for forwarding. The command show controllers cpu-interface (shown in Example 7-25) displays packet counts for packets that are forwarded to the CPU. If the retrieved packet counter in the sw forwarding row is rapidly increasing when you execute this command multiple times in a row, traffic is being switched in software by the CPU rather than in hardware by the TCAM. An increased CPU load usually accompanies this behavior.
Another way to spot potential TCAM-allocation failures is by observing traffic being punted to the CPU for forwarding. The command show controllers cpu-interface (shown in Example 7-25) displays packet counts for packets that are forwarded to the CPU. If the retrieved packet counter in the sw forwarding row is rapidly increasing when you execute this command multiple times in a row, traffic is being switched in software by the CPU rather than in hardware by the TCAM. An increased CPU load usually accompanies this behavior.
ASIC Rxbiterr Rxunder Fwdctfix Txbuflos Rxbufloc Rxbufdrain
—————————————————————————————————————-
ASIC0 0 0 0 0 0 0
cpu-queue-frames retrieved dropped invalid hol-block stray
———————— ————- ———- ———- ————- ——-
rpc 1 0 0 0 0
stp 853663 0 0 0 0
ipc 0 0 0 0 0
routing protocol 1580429 0 0 0 0
L2 protocol 22004 0 0 0 0
remote console 0 0 0 0 0
sw forwarding 1380174 0 0 0 0
<... further output omitted ...>
![]() You can conclude that it is important to recognize that TCAM resources are limited and that TCAM-allocation problems can lead to packets being switched by the CPU rather than the TCAM. This might overload the CPU and lead to dropping or slowdown of the CPU-forwarded traffic. In addition, a negative impact on control plane processes will be experienced. Whenever you observe performance problems for traffic passing through a switch and the CPU of that switch is consistently running at a very high load, you should find out whether the CPU is handling a significant amount of traffic forwarding, and if the latter is caused by exhaustion of TCAM resources.
You can conclude that it is important to recognize that TCAM resources are limited and that TCAM-allocation problems can lead to packets being switched by the CPU rather than the TCAM. This might overload the CPU and lead to dropping or slowdown of the CPU-forwarded traffic. In addition, a negative impact on control plane processes will be experienced. Whenever you observe performance problems for traffic passing through a switch and the CPU of that switch is consistently running at a very high load, you should find out whether the CPU is handling a significant amount of traffic forwarding, and if the latter is caused by exhaustion of TCAM resources.
![]() One remedy to the TCAM utilization and exhaustion problem is reducing the amount of information that the control plane feeds into the TCAM. For example, you can make use of techniques such as route summarization, route filtering, and access list (prefix list) optimization. Generally, TCAM is not upgradeable, so either the information that needs to be programmed into the TCAM needs to be reduced or you will have to upgrade to a higher-level switch, which can handle more TCAM entries. On some switches, such as the Catalyst 3560 and 3750 series of switches, the allocation of TCAM space among the different features can be changed. For example, if you are deploying a switch where it is almost exclusively involved in Layer 3 switching and next to no Layer 2 switching, you can choose a different template that sacrifices TCAM space for MAC address entries in favor of IP route entries. The TCAM allocation on the 3560 and 3750 series of switches is managed by the switch database manager (SDM). For more information, consult the SDM section of the configuration guide for the Catalyst 3560 or 3750 series switches at Cisco.com.
One remedy to the TCAM utilization and exhaustion problem is reducing the amount of information that the control plane feeds into the TCAM. For example, you can make use of techniques such as route summarization, route filtering, and access list (prefix list) optimization. Generally, TCAM is not upgradeable, so either the information that needs to be programmed into the TCAM needs to be reduced or you will have to upgrade to a higher-level switch, which can handle more TCAM entries. On some switches, such as the Catalyst 3560 and 3750 series of switches, the allocation of TCAM space among the different features can be changed. For example, if you are deploying a switch where it is almost exclusively involved in Layer 3 switching and next to no Layer 2 switching, you can choose a different template that sacrifices TCAM space for MAC address entries in favor of IP route entries. The TCAM allocation on the 3560 and 3750 series of switches is managed by the switch database manager (SDM). For more information, consult the SDM section of the configuration guide for the Catalyst 3560 or 3750 series switches at Cisco.com.
Control Plane: Troubleshooting High CPU Load on Switches
![]() On a switch, the CPU load is directly related to the traffic load. Because the bulk of the traffic is switched in hardware by the TCAM, the load of the CPU is often low even when the switch is forwarding a large amount of traffic. This behavior is not similar in routers: Low- to mid-range routers use the same CPU for packet forwarding that is also used for control plane functions, and therefore an increase in the traffic volume handled by the router can result in a proportional increase in CPU load. On switches, this direct relationship between CPU load and traffic load does not exist. The command to display the switch CPU load is show processes cpu, which is the same command used in routers. However, because of the difference in implementation of packet-switching process in routers and switches, the conclusions drawn from the output of this command usually differ. Example 7-26 shows sample output from this command.
On a switch, the CPU load is directly related to the traffic load. Because the bulk of the traffic is switched in hardware by the TCAM, the load of the CPU is often low even when the switch is forwarding a large amount of traffic. This behavior is not similar in routers: Low- to mid-range routers use the same CPU for packet forwarding that is also used for control plane functions, and therefore an increase in the traffic volume handled by the router can result in a proportional increase in CPU load. On switches, this direct relationship between CPU load and traffic load does not exist. The command to display the switch CPU load is show processes cpu, which is the same command used in routers. However, because of the difference in implementation of packet-switching process in routers and switches, the conclusions drawn from the output of this command usually differ. Example 7-26 shows sample output from this command.
CPU utilization for five seconds: 23%/18%; one minute: 24%; five minutes: 17%
! 23%, 24%, and 17% indicate total CPU spent on processes and interrupts
(packet switching). 18% indicates CPU spent on interrupts (packet switching)
PID Runtime(ms) Invoked uSecs 5Sec 1Min 5Min TTY Process
170 384912 1632941 235 0.47% 0.35% 0.23% 0 IP Input
63 8462 5449551 1 0.31% 0.52% 0.33% 0 HLFM address lea
274 101766 1410665 72 0.15% 0.07% 0.04% 0 HSRP IPv4
4 156599 21649 7233 0.00% 0.07% 0.05% 0 Check heaps
! Output omitted for brevity
![]() Example 7-26 shows a scenario where over the past 5 seconds, the switch consumed 23 percent of the available CPU cycles. Of those, 18 percent of CPU cycles were spent on interrupt processing, while only 5 percent was spent on the handling of control plane processes. For a router, this is perfectly acceptable and no reason for alarm. The CPU is forwarding packets and using the CPU to do so, and the total CPU usage is not high enough to warrant further investigation. Of course, this also depends on the normal baseline level of the CPU. However, on a switch, this same output is a reason to investigate. A switch should not spend a significant amount of CPU time on interrupt processing, because the TCAM should forward the bulk of the traffic and the CPU should not be involved. A percentage between 0 percent and 5 percent of CPU load spent on interrupts is considered normal, and a percentage between 5 percent and 10 percent is deemed acceptable, but when CPU time spent in interrupt mode is above 10 percent, you should start to investigate what might be the cause. If the CPU time spent in interrupt mode is high, this means that the switch is forwarding part of the traffic in software instead of the TCAM handling it. The most likely reason for this is TCAM-allocation failures or configuration of unsupported features that cannot be handled in hardware. To troubleshoot CPU problems effectively, it is important to have the baseline measurements for comparison purposes. In general, an average CPU load of 50 percent is not problematic, and temporary bursts to 100 percent are not problematic as long as there is a reasonable explanation for the observed peaks. The following events cause spikes in the CPU utilization:
Example 7-26 shows a scenario where over the past 5 seconds, the switch consumed 23 percent of the available CPU cycles. Of those, 18 percent of CPU cycles were spent on interrupt processing, while only 5 percent was spent on the handling of control plane processes. For a router, this is perfectly acceptable and no reason for alarm. The CPU is forwarding packets and using the CPU to do so, and the total CPU usage is not high enough to warrant further investigation. Of course, this also depends on the normal baseline level of the CPU. However, on a switch, this same output is a reason to investigate. A switch should not spend a significant amount of CPU time on interrupt processing, because the TCAM should forward the bulk of the traffic and the CPU should not be involved. A percentage between 0 percent and 5 percent of CPU load spent on interrupts is considered normal, and a percentage between 5 percent and 10 percent is deemed acceptable, but when CPU time spent in interrupt mode is above 10 percent, you should start to investigate what might be the cause. If the CPU time spent in interrupt mode is high, this means that the switch is forwarding part of the traffic in software instead of the TCAM handling it. The most likely reason for this is TCAM-allocation failures or configuration of unsupported features that cannot be handled in hardware. To troubleshoot CPU problems effectively, it is important to have the baseline measurements for comparison purposes. In general, an average CPU load of 50 percent is not problematic, and temporary bursts to 100 percent are not problematic as long as there is a reasonable explanation for the observed peaks. The following events cause spikes in the CPU utilization:
- Processor intensive Cisco IOS commands: Commands such as show tech-support or debugs, or even show running-configuration, copy running-config startup-config, and write memory are examples of CPU-intensive commands.
- Routing protocol update processing: If the switch is acting as a Layer 3 switch and participating in a routing protocol, it might experience peaks in CPU usage when many routing updates are received at the same time.
- SNMP polling: During SNMP discoveries or other bulk transfers of SNMP information by a network management system, the CPU can temporarily peak to 100 percent. If the SNMP process is constantly utilizing a high percentage of the available CPU cycles on a switch, investigate the settings on the network management station that is polling the device. The device might be polled too often, it might be polled for too much information, or both.
![]() If you are observing CPU spikes that cannot be explained by known events or if you are seeing that the CPU load is high for long periods, further investigation is warranted. First, you have to decide whether the load is caused by interrupts or by processes. If the load is mainly caused by interrupts, investigate the packet-switching behavior of the switch and look for possible TCAM-allocation problems. If the high load is mainly caused by processes, identify the responsible process or processes and see how these can be explained. Example 7-27 shows a case where the IP Input process is responsible for most of the CPU load. The IP Input process is responsible for all IP traffic that is not handled by the TCAM or forwarded in interrupt mode. This includes the transmission of ICMP messages such as unreachable or echo reply packets. Other processes that can be responsible for high CPU load are the following:
If you are observing CPU spikes that cannot be explained by known events or if you are seeing that the CPU load is high for long periods, further investigation is warranted. First, you have to decide whether the load is caused by interrupts or by processes. If the load is mainly caused by interrupts, investigate the packet-switching behavior of the switch and look for possible TCAM-allocation problems. If the high load is mainly caused by processes, identify the responsible process or processes and see how these can be explained. Example 7-27 shows a case where the IP Input process is responsible for most of the CPU load. The IP Input process is responsible for all IP traffic that is not handled by the TCAM or forwarded in interrupt mode. This includes the transmission of ICMP messages such as unreachable or echo reply packets. Other processes that can be responsible for high CPU load are the following:
- IP ARP: This process handles Address Resolutions Protocol (ARP) requests.
- SNMP Engine: This process is responsible for answering SNMP requests.
- IGMPSN: This process is responsible for Internet Group Management Protocol (IGMP) snooping and processes IGMP packets.
CPU utilization for five seconds: 32%/4%; one minute: 32%; five minutes: 26%
PID Runtime(ms) Invoked uSecs 5Sec 1Min 5Min TTY Process
170 492557 1723695 285 22.52% 20.57% 15.49% 0 IP Input
95 7809 693 11268 0.00% 0.00% 0.41% 0 Exec
274 101766 1410665 72 0.15% 0.15% 0.09% 0 HSRP IPv4
4 158998 21932 7249 0.00% 0.06% 0.05% 0 Check heaps
! Output omitted for brevity
![]() A high CPU load due to control plane protocols, such as routing protocols, first-hop redundancy protocols, ARP, and others might be caused by a broadcast storm in the underlying Layer 2 network. In that case, the routing protocols are not the root cause of the problem, but their behavior is a symptom of the underlying problem. This type of scenario is usually dealt with in two stages. For example, assume that a switch is running at 100 percent CPU, because protocols such as the Hot Standby Router Protocol (HSRP), Open Shortest Path First (OSPF), ARP, and the IEEE Spanning Tree Protocol (STP) are all using many CPU cycles as a result of a broadcast storm in the switched network. In this case, consider implementing broadcast and multicast storm control to limit the impact of the excessive broadcasts and multicasts generated by the broadcast storm. However, this is only a workaround, which will help you make the switch more manageable, but it does not solve the underlying problem. The problem could be due to a topological loop, unidirectional link, or a spanning-tree misconfiguration, for example. After implementing this workaround, you must diagnose and resolve the underlying problem that caused the broadcast storm.
A high CPU load due to control plane protocols, such as routing protocols, first-hop redundancy protocols, ARP, and others might be caused by a broadcast storm in the underlying Layer 2 network. In that case, the routing protocols are not the root cause of the problem, but their behavior is a symptom of the underlying problem. This type of scenario is usually dealt with in two stages. For example, assume that a switch is running at 100 percent CPU, because protocols such as the Hot Standby Router Protocol (HSRP), Open Shortest Path First (OSPF), ARP, and the IEEE Spanning Tree Protocol (STP) are all using many CPU cycles as a result of a broadcast storm in the switched network. In this case, consider implementing broadcast and multicast storm control to limit the impact of the excessive broadcasts and multicasts generated by the broadcast storm. However, this is only a workaround, which will help you make the switch more manageable, but it does not solve the underlying problem. The problem could be due to a topological loop, unidirectional link, or a spanning-tree misconfiguration, for example. After implementing this workaround, you must diagnose and resolve the underlying problem that caused the broadcast storm.
DHCP Issues
![]() Dynamic Host Configuration Protocol (DHCP) is commonly used in LAN environments, and sometimes the multilayer switch is configured as a DHCP server. Many issues related to DHCP can result in performance degradation. For example, as shown in Figure 7-12, interface GigabitEthernet0/1 on the switch will forward the broadcasted DHCPDISCOVER of the client to 192.168.2.2.
Dynamic Host Configuration Protocol (DHCP) is commonly used in LAN environments, and sometimes the multilayer switch is configured as a DHCP server. Many issues related to DHCP can result in performance degradation. For example, as shown in Figure 7-12, interface GigabitEthernet0/1 on the switch will forward the broadcasted DHCPDISCOVER of the client to 192.168.2.2.


![]() The limit rate command on the G0/1 interface will limit the number of DHCP messages that an interface can receive per second, and can have an impact on switch performance if set incorrectly. This issue is related to misconfiguration, and even though the network is to blame in terms of the apparent source of the issue, the actual problem is related to poor planning and baselining of the network and improper tuning of a feature such as DHCP snooping.
The limit rate command on the G0/1 interface will limit the number of DHCP messages that an interface can receive per second, and can have an impact on switch performance if set incorrectly. This issue is related to misconfiguration, and even though the network is to blame in terms of the apparent source of the issue, the actual problem is related to poor planning and baselining of the network and improper tuning of a feature such as DHCP snooping.
![]() Other sources of DHCP issues that can have performance impact can be subject to abuse by nonmalicious and malicious users. In the case of malicious attacks, many exploit tools are readily available and are easy to use. An example of those tools is Gobbler, a public domain hacking tool that performs automated DHCP starvation attacks. DHCP starvation can be purely a denial-of-service (DoS) mechanism or can be used in conjunction with a malicious rogue server attack to redirect traffic to a malicious computer ready to intercept traffic. This method effectively performs DoS attacks using DHCP leases. Gobbler looks at the entire DHCP pool and tries to lease all the DHCP addresses available in the DHCP scope. Several security controls, such as port security, DHCP snooping, and DHCP rate limits, are available to mitigate this type of attack. However, you must consider security vulnerabilities and threats when isolating the problem from a troubleshooting perspective.
Other sources of DHCP issues that can have performance impact can be subject to abuse by nonmalicious and malicious users. In the case of malicious attacks, many exploit tools are readily available and are easy to use. An example of those tools is Gobbler, a public domain hacking tool that performs automated DHCP starvation attacks. DHCP starvation can be purely a denial-of-service (DoS) mechanism or can be used in conjunction with a malicious rogue server attack to redirect traffic to a malicious computer ready to intercept traffic. This method effectively performs DoS attacks using DHCP leases. Gobbler looks at the entire DHCP pool and tries to lease all the DHCP addresses available in the DHCP scope. Several security controls, such as port security, DHCP snooping, and DHCP rate limits, are available to mitigate this type of attack. However, you must consider security vulnerabilities and threats when isolating the problem from a troubleshooting perspective.
Spanning-Tree Issues
![]() STP is a common source of switch performance degradation. An ill-behaving instance of STP might slow down the network and the switch. The impact is that the switch might drop bridge protocol data units (BPDUs), and as a result go into Listening state. This problem causes unneeded reconvergence phases that lead to even more congestion and performance degradation. STP issues can also cause topology loops. If one or more switches no longer receive or process BPDUs, they will not be able to discover the network topology. Without knowledge of the correct topology, the switch cannot block the loops. Therefore, the flooded traffic will circulate over the looped topology, consume bandwidth, and result in high CPU utilization. Other STP situations include issues related to capacity planning. Per-VLAN Spanning Tree Plus (PVST+) creates an instance of the protocol for each VLAN. When many VLANs exist, each additional instance represents a burden. The CPU time utilized by STP varies depending on the number of spanning-tree instances and the number of active interfaces. The more instances and the more active interfaces, the greater the CPU utilization.
STP is a common source of switch performance degradation. An ill-behaving instance of STP might slow down the network and the switch. The impact is that the switch might drop bridge protocol data units (BPDUs), and as a result go into Listening state. This problem causes unneeded reconvergence phases that lead to even more congestion and performance degradation. STP issues can also cause topology loops. If one or more switches no longer receive or process BPDUs, they will not be able to discover the network topology. Without knowledge of the correct topology, the switch cannot block the loops. Therefore, the flooded traffic will circulate over the looped topology, consume bandwidth, and result in high CPU utilization. Other STP situations include issues related to capacity planning. Per-VLAN Spanning Tree Plus (PVST+) creates an instance of the protocol for each VLAN. When many VLANs exist, each additional instance represents a burden. The CPU time utilized by STP varies depending on the number of spanning-tree instances and the number of active interfaces. The more instances and the more active interfaces, the greater the CPU utilization.
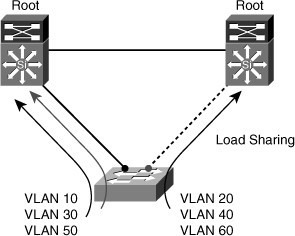
![]() STP might also impact on network and bandwidth utilization. Most recommendations call for a deterministic approach to selecting root bridges. In Figure 7-13, there are two roots: one for VLANs 10, 30, and 50; and the other for VLANs 20, 40, and 60. This way, the designated or blocked ports are selected in such a way that allows for load sharing across the infrastructure. If, on the other hand, only one root is selected, there will be only one blocked port for all VLANs, preventing a more balanced utilization of all links.
STP might also impact on network and bandwidth utilization. Most recommendations call for a deterministic approach to selecting root bridges. In Figure 7-13, there are two roots: one for VLANs 10, 30, and 50; and the other for VLANs 20, 40, and 60. This way, the designated or blocked ports are selected in such a way that allows for load sharing across the infrastructure. If, on the other hand, only one root is selected, there will be only one blocked port for all VLANs, preventing a more balanced utilization of all links.
![]() Finally, by just having poor control over the selection of root bridges, you could be causing severe traffic performance problems. For example, if an access switch is selected as the root, a high-bandwidth link between switches might go into Blocking state, or the simple access switch might become a transit point and be flooded and overwhelmed.
Finally, by just having poor control over the selection of root bridges, you could be causing severe traffic performance problems. For example, if an access switch is selected as the root, a high-bandwidth link between switches might go into Blocking state, or the simple access switch might become a transit point and be flooded and overwhelmed.
HSRP
![]() Hot Standby Router Protocol (HSRP) is another common function implemented in switches. Because of the nature of HSRP, specific network problems can lead to HSRP instability and to performance degradation. Several HSRP-related problems are not true HSRP issues. Instead, they are network problems that affect the behavior of HSRP. Common HSRP-specific issues include the following:
Hot Standby Router Protocol (HSRP) is another common function implemented in switches. Because of the nature of HSRP, specific network problems can lead to HSRP instability and to performance degradation. Several HSRP-related problems are not true HSRP issues. Instead, they are network problems that affect the behavior of HSRP. Common HSRP-specific issues include the following:
- Duplicate HSRP standby IP addresses: This problem typically occurs when both switches in the HSRP group go into the active state. A variety of problems can cause this behavior, including momentary STP loops, EtherChannel configuration issues, or duplicated frames.
- Constant HSRP state changes: These changes cause network performance problems, application timeouts, and connectivity disruption. Poor selection of HSRP timers, such as hello and hold time, in the presence of flapping links or hardware issues, can cause the state changes.
- Missing HSRP peers: If an HSRP peer is missing, the fault tolerance offered by HSRP is at stake. The peer may only appear as missing because of network problems.
- Switch error messages that relate to HSRP: These messages might indicate issues such as duplicate addresses that need to be addressed.
Switch Performance Troubleshooting Example: Speed and Duplex Settings
![]() The first switch performance troubleshooting example is a case of a user complaining about speed issues when downloading large files from a file server. This user has been using his PC for several months and never noticed a problem before. The problem occurred after a maintenance window over the weekend. Although the user can access the file server, the speed, when downloading large files, is unacceptable. You must determine whether there has been any degradation in network performance over the weekend and restore the connectivity to its original performance levels. You need to decide on a troubleshooting method. The difficulty in this kind of case is that it revolves around performance issues, and performance is something that can be very subjective. Determining a baseline is a critical part of analyzing this troubleshooting task. If you have a baseline and can compare current performance against pervious performance, you can determine if there is in fact degradation in network performance. After establishing that, you can look for places in the network where this degradation may occur. In this case, we have a simple scenario with one switch one PC and one file server, as shown in Figure 7-14. If there is degradation of performance, it has to be occurring between the PC and the switch, within the switch, or between the switch and the file server. The fact that no other users are complaining about download speed might lead you to believe that this problem is between the PC and the switch.
The first switch performance troubleshooting example is a case of a user complaining about speed issues when downloading large files from a file server. This user has been using his PC for several months and never noticed a problem before. The problem occurred after a maintenance window over the weekend. Although the user can access the file server, the speed, when downloading large files, is unacceptable. You must determine whether there has been any degradation in network performance over the weekend and restore the connectivity to its original performance levels. You need to decide on a troubleshooting method. The difficulty in this kind of case is that it revolves around performance issues, and performance is something that can be very subjective. Determining a baseline is a critical part of analyzing this troubleshooting task. If you have a baseline and can compare current performance against pervious performance, you can determine if there is in fact degradation in network performance. After establishing that, you can look for places in the network where this degradation may occur. In this case, we have a simple scenario with one switch one PC and one file server, as shown in Figure 7-14. If there is degradation of performance, it has to be occurring between the PC and the switch, within the switch, or between the switch and the file server. The fact that no other users are complaining about download speed might lead you to believe that this problem is between the PC and the switch.
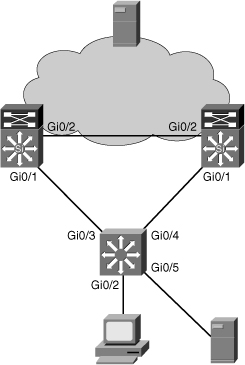
![]() A call to the maintenance team tells you that the maintenance over the weekend involved reorganizing the switch’s connectivity to the network. In other words, port configurations were changed, and PCs were connected to different ports over the weekend. This points to a problem with the port to which the PC connects. The fact that the PC and the file server are in the same VLAN makes it unlikely that the issue comes from the switch itself. Because both devices are in the same VLAN, switching occurs in hardware, and should be very fast. To be thorough, confirm the PC connection to the switch and the file server connection to the switch. The first task is to confirm the interfaces with the show interfaces command, as demonstrated in Example 7-28. The output confirms that the interface connecting to the PC is up and line protocol is up. So, everything seems to be normal on that side. Using the same command for the file server interface shows the same status. So, there is no problem with the connection itself. If the user can connect to the Internet and the network and download files from the file server, the issue is not about connectivity, it is about performance.
A call to the maintenance team tells you that the maintenance over the weekend involved reorganizing the switch’s connectivity to the network. In other words, port configurations were changed, and PCs were connected to different ports over the weekend. This points to a problem with the port to which the PC connects. The fact that the PC and the file server are in the same VLAN makes it unlikely that the issue comes from the switch itself. Because both devices are in the same VLAN, switching occurs in hardware, and should be very fast. To be thorough, confirm the PC connection to the switch and the file server connection to the switch. The first task is to confirm the interfaces with the show interfaces command, as demonstrated in Example 7-28. The output confirms that the interface connecting to the PC is up and line protocol is up. So, everything seems to be normal on that side. Using the same command for the file server interface shows the same status. So, there is no problem with the connection itself. If the user can connect to the Internet and the network and download files from the file server, the issue is not about connectivity, it is about performance.
GigabitEthernet0/2 is up, line protocol is up (connected)
Hardware is Gigabit Ethernet, address is 0023.5d08.5682 (bia 0023.5d08.5682)
Description: to new PC
! Output omitted for brevity
Switch# show interfaces Gi 0/5
GigabitEthernet0/5 is up, line protocol is up (connected)
Hardware is Gigabit Ethernet, address is 0023.5d08.5685 (bia 0023.5d08.5685)
Description: to file server
! Output omitted for brevity
![]() You now use the show controller utilization command to check the bandwidth utilization on the ports connecting to the server (port G0/5) and the client (port G0/2). This can help you verify that you indeed have a performance issue as demonstrated in Example 7-29. The large discrepancy in the receive and transmit utilization on the user port is due to the fact that the traffic is mostly file downloads. The user is receiving much more than he is sending.
You now use the show controller utilization command to check the bandwidth utilization on the ports connecting to the server (port G0/5) and the client (port G0/2). This can help you verify that you indeed have a performance issue as demonstrated in Example 7-29. The large discrepancy in the receive and transmit utilization on the user port is due to the fact that the traffic is mostly file downloads. The user is receiving much more than he is sending.
Receive Bandwidth Percentage Utilization : 0
Transmit Bandwidth Percentage Utilization : 0
Switch# sh controller g0/2 utilization
Receive Bandwidth Percentage Utilization : 2
Transmit Bandwidth Percentage Utilization : 76
Switch#
![]() Next, you ask the user to start a download so that you can monitor the performance of the connection, but first you clear the counters for the user interface. While the download runs, there are useful commands to monitor activity on the interface. The first command is show interface accounting, which shows you what kind of traffic is going through the interface. The output (as shown in Example 7-30) shows some STP packets, Cisco Discovery Protocol (CDP) packets, and other packets. There is not a lot of activity, so you do not expect a loop or spanning-tree issue. The traffic bottleneck must come from data itself.
Next, you ask the user to start a download so that you can monitor the performance of the connection, but first you clear the counters for the user interface. While the download runs, there are useful commands to monitor activity on the interface. The first command is show interface accounting, which shows you what kind of traffic is going through the interface. The output (as shown in Example 7-30) shows some STP packets, Cisco Discovery Protocol (CDP) packets, and other packets. There is not a lot of activity, so you do not expect a loop or spanning-tree issue. The traffic bottleneck must come from data itself.
Clear "show interface" counters on this interface [confirm]
Switch#
Switch# sh int g0/2 accounting
GigabitEthernet0/2 to new PC
Protocol Pkts In Chars In Pkts Out Chars Out
Other 0 0 6 360
Spanning Tree 0 0 32 1920
CDP 0 0 1 397
Switch#
![]() To find out why the user application is slow, use the show interface g0/2 stats command as demonstrated in Example 7-31. Of course, the values here do not mean much without a baseline for comparison; however, considering the switch model and the overall traffic on the network, it is safe to assume that these values are within the normal range. So, the switch itself is performing normally. Immediately, you try the show interface counters errors command to have a closer look at the interface error counters. As shown in Example 7-31, the single-collision and multiple-collision counters report the number of times a collision occurred before the interface transmitted a frame onto the media successfully. In other words, the switch tried to transmit a frame to the PC, but a collision occurred, and the frame could not be transmitted. When the frame could not be sent the first time and succeeded the second time, you see the single-collision counter increment. If the same frame suffers a number of collisions, the multiple-collision counters increase. This output shows a lot of single collisions and quite a few multiple collisions. The OutDiscards counter is also noteworthy. This counter shows the number of outbound frames discarded even though no error has been detected. In other words, the switch needed to send these frames, but ended up discarding them without sending them at all, possibly to free up buffer space. In other words, the speed of the link is so slow that the switch cannot send the frame in a reasonable time and has to discard it.
To find out why the user application is slow, use the show interface g0/2 stats command as demonstrated in Example 7-31. Of course, the values here do not mean much without a baseline for comparison; however, considering the switch model and the overall traffic on the network, it is safe to assume that these values are within the normal range. So, the switch itself is performing normally. Immediately, you try the show interface counters errors command to have a closer look at the interface error counters. As shown in Example 7-31, the single-collision and multiple-collision counters report the number of times a collision occurred before the interface transmitted a frame onto the media successfully. In other words, the switch tried to transmit a frame to the PC, but a collision occurred, and the frame could not be transmitted. When the frame could not be sent the first time and succeeded the second time, you see the single-collision counter increment. If the same frame suffers a number of collisions, the multiple-collision counters increase. This output shows a lot of single collisions and quite a few multiple collisions. The OutDiscards counter is also noteworthy. This counter shows the number of outbound frames discarded even though no error has been detected. In other words, the switch needed to send these frames, but ended up discarding them without sending them at all, possibly to free up buffer space. In other words, the speed of the link is so slow that the switch cannot send the frame in a reasonable time and has to discard it.
GigabitEthernet0/2
Switching path Pkts In Chars In Pkts Out Chars Out
Processor 0 0 156 11332
Route cache 0 0 0 0
Total 0 0 156 11332
Switch#
Switch#show int g0/2 counters errors
Port Align-Err FCS-Err Xmit-Err Rcv-Err UnderSize OutDiscards
Gi0/2 0 0 0 0 0 3495
Port Single-Col Multi-Col Late-Col Excess-Col Carri-Sen Runts Giants
Gi0/2 126243 37823 0 0 0 0 0
Switch#
![]() The PCs are new enough to support full duplex, so there should not be any collisions. You verify the switch interface for parameters such as speed and duplex setting. The results shown in Example 7-32 reveal that the interface is set to half duplex and 10 Mbps. This could be a configuration mistake or due to autonegotiation with the PC.
The PCs are new enough to support full duplex, so there should not be any collisions. You verify the switch interface for parameters such as speed and duplex setting. The results shown in Example 7-32 reveal that the interface is set to half duplex and 10 Mbps. This could be a configuration mistake or due to autonegotiation with the PC.
Half-duplex, 10Mb/s, media type is 10/100/1000BaseTX
Switch#
![]() The running configuration for the switch interface, shown in Example 7-33, reveals that it is manually configured. You know that PCs were moved over the weekend. Perhaps the device that was once connected to this port required half duplex and 10 Mbps. Therefore, you reconfigure the interface to auto speed and duplex settings and confirm with the user that this has resolved the issue.
The running configuration for the switch interface, shown in Example 7-33, reveals that it is manually configured. You know that PCs were moved over the weekend. Perhaps the device that was once connected to this port required half duplex and 10 Mbps. Therefore, you reconfigure the interface to auto speed and duplex settings and confirm with the user that this has resolved the issue.
Building configuration...
Current configuration : 166 bytes
!
interface GigabitEthernet0/2
description to new PC
switchport access vlan 50
switchport mode access
speed 10
duplex half
mls qos trust cos
no mdix auto
end
Switch#
Switch# configure terminal
Enter configuration commands, one per line. End with CNTL/Z.
Switch(config)# int g0/2
Switch(config-if)# speed auto
% Speed autonegotiation subset must not contain 1Gbps when duplex is set to half
Switch(config-if)# duplex auto
Switch(config-if)# end
Switch#
Switch Performance Troubleshooting Example: Excessive Broadcasts
![]() The second switch performance troubleshooting example concerns a user with complaints about connectivity issues. The user reports that sometimes he cannot connect to the network at all, and his PC will not even get an IP address. Other times, he is able to connect, but the connection is of poor quality (experiencing slow downloads and connection timeouts). The issue seems to have started a few days ago and is not consistently occurring all day long. Because several other users have also reported the issue and they all connect to the same switch, the most logical approach is “follow the path.” The place to start is with one PC’s connectivity to the switch and then verifying the switch itself. Next, you’ll verify the uplink from the switch to the rest of the network. You start troubleshooting at port GigabitEthernet0/2 where the user the PC is connected to, by checking the speed and duplex setting, controller utilization, and interface errors. The results are shown in Example 7-34. The port is operating at full duplex and 1000 Mbps, and the show controllers g0/2 utilization displays a near 0 port utilization. You need to verify that the PC is actually connected. The show interfaces command reveals that the interface is up and line protocol is up, and the statistics near the bottom of the output seem normal.
The second switch performance troubleshooting example concerns a user with complaints about connectivity issues. The user reports that sometimes he cannot connect to the network at all, and his PC will not even get an IP address. Other times, he is able to connect, but the connection is of poor quality (experiencing slow downloads and connection timeouts). The issue seems to have started a few days ago and is not consistently occurring all day long. Because several other users have also reported the issue and they all connect to the same switch, the most logical approach is “follow the path.” The place to start is with one PC’s connectivity to the switch and then verifying the switch itself. Next, you’ll verify the uplink from the switch to the rest of the network. You start troubleshooting at port GigabitEthernet0/2 where the user the PC is connected to, by checking the speed and duplex setting, controller utilization, and interface errors. The results are shown in Example 7-34. The port is operating at full duplex and 1000 Mbps, and the show controllers g0/2 utilization displays a near 0 port utilization. You need to verify that the PC is actually connected. The show interfaces command reveals that the interface is up and line protocol is up, and the statistics near the bottom of the output seem normal.
Full-duplex, 1000Mb/s, media type is 10/100/1000BaseTX
Switch#
Switch# show controllers g0/2 utilization
Receive Bandwidth Percentage utilization : 0
Transmit Bandwidth Percentage utilization : 0
Switch# show int g0/2
GigabitEthernet0/2 is up, line protocol is up (connected)
Hardware is Gigabit Ethernet, address is 0023.5d08.5682 (bia 0023.5d08.5682)
Description: to new PC
MTU 1504 bytes, BW 1000000 Kbit, DLY 10 usec,
reliability 255/255, txload 4/255, rxload 1/255
Encapsulation ARPA, loopback not set
Keepalive set (10 sec)
Full-duplex, 1000Mb/s, media type is 10/100/1000BaseTX
input flow-control is off, output flow-control is unsupported
ARP type: ARPA, ARP Timeout 04:00:00
Last input never, output 00:00:00, output hang never
Last clearing of "show interface" counters 01:01:23
Input Queue: 0/75/0/0 (size/max/drops/flushes); Total output drops: 74855
Queueing strategy: fifo
Output queue: 0/40 (size/max)
5 minute input rate 128000 bits/sec, 261 packets/sec
5 minute output rate 17019000 bits/sec, 6559 packets/sec
400082 packets input, 26803863 bytes, 0 no buffer
Received 174 broadcasts (21 multicasts)
0 runts, 0 giants, 0 throttles
0 input errores, 0 CRC, 0 frame, 0 overrun, 0 ignored
0 watchdog, 21 multicast, 0 pause input
0 input packets with dribble condition detected
10277284 packets output, 2907407121 bytes, 0 underruns
0 output errors, 207597 collisions, 2 interface resets
0 babbles, 0 late collision, 0 deferred
0 lost carrier, 0 no carrier, 0 PAUSE output
0 output buffer failures, 0 output buffers swapped out
Switch#
![]() Because there is no communication problem between the switch and the PC, the problem might be within the switch itself. Check to see whether the switch is overloaded using the show processes cpu command, as demonstrated in Example 7-35. The output displays that CPU utilization is 98 percent over 5 seconds, 94 percent over 1 minute, and 92 percent over 5 minutes! That is very high: the switch is definitely overloaded, and you need to find out why.
Because there is no communication problem between the switch and the PC, the problem might be within the switch itself. Check to see whether the switch is overloaded using the show processes cpu command, as demonstrated in Example 7-35. The output displays that CPU utilization is 98 percent over 5 seconds, 94 percent over 1 minute, and 92 percent over 5 minutes! That is very high: the switch is definitely overloaded, and you need to find out why.
CPU utilization for five seconds: 98%/18%; one minute: 94%; five minutes 92%
PID Runtime(ms) Invoked usecs 5Sec 1Min 5Min TTY Process
1 0 15 0 0.00% 0.00% 0.00% 0 Chunk Manager
2 24 1517 15 0.00% 0.00% 0.00% 0 Load Meter
3 0 1 0 0.00% 0.00% 0.00% 0 CEF RP IPC Backg
4 16496 1206 13678 0.00% 0.00% 0.00% 0 Check heaps
5 0 1 0 0.00% 0.00% 0.00% 0 Pool Manager
6 0 2 0 0.00% 0.00% 0.00% 0 Timers
7 0 1 0 0.00% 0.00% 0.00% 0 Image Licensing
8 0 2 0 0.00% 0.00% 0.00% 0 License Client N
9 2293 26 115115 0.00% 0.00% 0.00% 0 Licensing Auto U
10 0 1 0 0.00% 0.00% 0.00% 0 Crash writer
11 3330507 521208 6389 44.08% 37.34% 33.94% 0 ARP Input
12 0 1 0 0.00% 0.00% 0.00% 0 CEF MIB API
13 0 1 0 0.00% 0.00% 0.00% 0 AAA_SERVER_DEADT
14 0 2 0 0.00% 0.00% 0.00% 0 AAA high-capacit
15 0 1 0 0.00% 0.00% 0.00% 0 Policy Manager
16 0 5 1800 0.00% 0.00% 0.00% 0 Entity MIB API
17 0 1 0 0.00% 0.00% 0.00% 0 IFS Agent Manage
18 0 128 0 0.00% 0.00% 0.00% 0 IPC Dynamic Cach
--More--
![]() Next, use the show processes cpu sorted command, which classifies the processes by task and CPU consumption, to discover the processes that use up most of the CPU cycles. The results shown in Example 7-36 reveal that ARP is consuming half of the resources on this switch. That is definitely not normal. Having a certain amount of ARP processing is normal, but not to the point where it is consuming more than 40 percent of the resources. Using the command show interfaces accounting, you discover that vlan10 is the where the excessive ARP packets are located (also shown in Example 7-36).
Next, use the show processes cpu sorted command, which classifies the processes by task and CPU consumption, to discover the processes that use up most of the CPU cycles. The results shown in Example 7-36 reveal that ARP is consuming half of the resources on this switch. That is definitely not normal. Having a certain amount of ARP processing is normal, but not to the point where it is consuming more than 40 percent of the resources. Using the command show interfaces accounting, you discover that vlan10 is the where the excessive ARP packets are located (also shown in Example 7-36).
Switch# show processes cpu sorted
CPU utilization for five seconds: 94%/19%; one minute: 97%; five minutes: 94%
PID   Runtime(ms)   Invoked   usecs   5Sec    1Min   5Min  TTY  Process
11       3384474    529325    6393 42.97%  41.59% 36.35%    0  ARP Input
178       2260178    569064    2971 15.01%  17.25% 21.34%    0  IP Input
205         31442     26263    1197  5.43%   6.31%  4.38%    0  DHCPD Receive
124        341457    215879    1581  2.71%   3.02%  2.91%    0  Hulc LED Process
89        289092    180034    1605  2.55%   2.77%  2.70%    0  hpm main process
92         80558      7535   10691  0.63%   0.79%  0.83%    0  hpm counter proc
183          1872      1379    1357  0.15%   0.08%  0.03%    1  virtual Exec
31          2004      4898     409  0.15%   0.02%  0.00%    0  Net Background
184          5004     19263     259  0.15%   0.04%  0.02%    0  Spanning Tree
132         19307      1549   12464  0.15%   0.17%  0.16%    0  HQM Stack Proces
72         26070    209264     124  0.15%   0.13%  0.15%    0  HLFM address lea
56         31258    115660     270  0.15%   0.29%  0.27%    0  RedEarth Tx Mana
112          6672     37587     177  0.15%   0.07%  0.04%    0  Hulc Storm Contr
13             0         1       0  0.00%   0.00%  0.00%    0  AAA_SERVER_DEADT
15             0         1       0  0.00%   0.00%  0.00%    0  Policy Manager
14             0         2       0  0.00%   0.00%  0.00%    0  AAA high-capacit
12             0         1       0  0.00%   0.00%  0.00%    0  CEF MIB API
18             0       129       0  0.00%   0.00%  0.00%    0  IPC Dynamic Cach
--More--
Switch# show interfaces accounting
vlan1
                Protocol    Pkts  In   Chars In   Pkts Out   Chars Out
                      IP          35       4038          2         684
                     ARP          13        780         15         900
vlan6
                Protocol     Pkts In   Chars In   Pkts Out   Chars Out
                     ARP           0          0         14         840
vlan8
                Protocol     Pkts In   Chars In   Pkts Out   Chars Out
                     ARP           0          0         14         840
vlan10
                Protocol     Pkts In   Chars In   Pkts Out   Chars Out
                      IP    16705943 1727686324      77739    26586738
                     ARP    10594397  635663820        484       29040

Vlan12
                Protocol     Pkts In   Chars In   Pkts Out   Chars Out
                     ARP           0          0         14         840
--More--
![]() The show vlan command (not shown) reveals that Gi 0/2, 9, 11, 12, 13, and 22 are in vlan10.
The show vlan command (not shown) reveals that Gi 0/2, 9, 11, 12, 13, and 22 are in vlan10.
![]() To find out which of these ports is the source of the excessive ARP packets, use the show interfaces interface controller include broadcasts command. This command, with the include broadcasts parameter, displays the broadcast section of the output only. The results, shown in Example 7-37, point to g0/11 and g0/13 ports, to which the wireless access points (WAPs) are connected. You now know that these are the broadcasts from the wireless clients, and because the WAPs act like hubs, they forward all their client broadcasts to the switch.
To find out which of these ports is the source of the excessive ARP packets, use the show interfaces interface controller include broadcasts command. This command, with the include broadcasts parameter, displays the broadcast section of the output only. The results, shown in Example 7-37, point to g0/11 and g0/13 ports, to which the wireless access points (WAPs) are connected. You now know that these are the broadcasts from the wireless clients, and because the WAPs act like hubs, they forward all their client broadcasts to the switch.
Received 236 broadcasts (28 multicasts)
Switch# show interfaces g0/9 controller | inc broadcast
Received 0 broadcasts (0 multicasts)
Switch# show interfaces g0/11 controller | inc broadcast
Received 2829685 broadcasts (2638882 multicasts)
Switch# show interfaces g0/13 controller | inc broadcast
Received 41685559 broadcasts (145888 multicasts)
Switch# show interfaces g0/22 controller | inc broadcast
Received 0 broadcasts (0 multicasts)
Switch#
![]() To reduce the impact of the wireless broadcast on the wired network, you can limit the amount of broadcasts the switch accepts from those ports. As demonstrated in Example 7-38, you use the storm-control command on g0/11 and g0/13 interfaces to limit broadcasts (because ARP requests are broadcasts) to three packets per second. Next, you observe the positive results on the output of the show processes cpu sorted command. You confirm with the users that they are no longer experiencing any problems and document your work.
To reduce the impact of the wireless broadcast on the wired network, you can limit the amount of broadcasts the switch accepts from those ports. As demonstrated in Example 7-38, you use the storm-control command on g0/11 and g0/13 interfaces to limit broadcasts (because ARP requests are broadcasts) to three packets per second. Next, you observe the positive results on the output of the show processes cpu sorted command. You confirm with the users that they are no longer experiencing any problems and document your work.
Enter configuration commands, one per line. End with CNTL/Z.
Switch(config)# int g0/11
Switch(config-if)# storm-control broadcast level pps 3
Switch(config-if)# int g0/13
Switch(config-if)# storm-control broadcast level pps 3
Switch(config-if)# end
Switch#
Switch# sh process cpu sorted
PID Runtime(ms) Invoked usecs 5Sec 1Min 5Min TTY Process
11 3770480 607472 6206 11.50% 3.65% 4.94% 0 ARP Input
4 19773 1472 13432 0.31% 0.11% 0.11% 0 Check heaps
144 7650 9228 828 0.15% 0.11% 0.13% 0 PI MATM Aging Pr
183 2559 2062 1241 0.15% 0.03% 0.00% 1 Virtual Exec
214 9467 20611 459 0.15% 0.01% 0.00% 0 Marvell wk-a Pow
92 91428 9224 9911 0.15% 0.23% 0.30% 0 hpm counter proc
89 316788 218111 1452 0.15% 0.24% 0.39% 0 hpm main process
7 0 1 0 0.00% 0.00% 0.00% 0 Image Licensing
6 0 2 0 0.00% 0.00% 0.00% 0 Timers
5 0 1 0 0.00% 0.00% 0.00% 0 Pool Manager
8 0 2 0 0.00% 0.00% 0.00% 0 License Client N
9 3714 32 116062 0.00% 0.01% 0.00% 0 Licensing Auto U
13 0 1 0 0.00% 0.00% 0.00% 0 AAA_SERVER_DEADT
10 0 1 0 0.00% 0.00% 0.00% 0 Crash writer
2 24 1878 12 0.00% 0.00% 0.00% 0 Load Meter
16 9 5 1800 0.00% 0.00% 0.00% 0 Entity MIB API
17 0 1 0 0.00% 0.00% 0.00% 0 IFS Agent Manage
12 0 1 0 0.00% 0.00% 0.00% 0 CEF MIB API
--More--
Switch Performance Troubleshooting Example: Excessive Security
![]() The third and final switch performance troubleshooting example is about a case where users connecting to a specific switch have connectivity issues and say that while working with their PCs a window sometimes pops up indicating that their network cable is unplugged. At other times, the PC reports that the cable is plugged in, but the connection is very bad. Many of the user workstations cannot even obtain an IP address from the DHCP server. Those who do receive IP addresses find the network unusable. Almost all users connected to this switch experience the same problem. When you look at the maintenance log for this network, you see that a security update occurred on this switch. When security is involved, a common approach is divide and conquer, starting at Layer 4, and determine whether the problem is above or below this layer. Often when security is involved, Layer 3 or Layer 4 security policies are blocking the traffic. However, you cannot ignore the PC message that says the cable is unplugged. That cannot be a security configuration, and you need to investigate.
The third and final switch performance troubleshooting example is about a case where users connecting to a specific switch have connectivity issues and say that while working with their PCs a window sometimes pops up indicating that their network cable is unplugged. At other times, the PC reports that the cable is plugged in, but the connection is very bad. Many of the user workstations cannot even obtain an IP address from the DHCP server. Those who do receive IP addresses find the network unusable. Almost all users connected to this switch experience the same problem. When you look at the maintenance log for this network, you see that a security update occurred on this switch. When security is involved, a common approach is divide and conquer, starting at Layer 4, and determine whether the problem is above or below this layer. Often when security is involved, Layer 3 or Layer 4 security policies are blocking the traffic. However, you cannot ignore the PC message that says the cable is unplugged. That cannot be a security configuration, and you need to investigate.
![]() Use a bottom-up approach for this example, starting at one of the PCs, which is connected to the switch Gi0/2 interface. You first confirm that the PC is connected using the show interfaces command, and see that it is up/up (see the results in Example 7-39). You must remember that the user reported that the connection is intermittent, so although it might be connected now, it might have been disconnected a moment ago. Therefore, you reset the counters on the interface.
Use a bottom-up approach for this example, starting at one of the PCs, which is connected to the switch Gi0/2 interface. You first confirm that the PC is connected using the show interfaces command, and see that it is up/up (see the results in Example 7-39). You must remember that the user reported that the connection is intermittent, so although it might be connected now, it might have been disconnected a moment ago. Therefore, you reset the counters on the interface.
GigabitEthernet0/2 is up, line protocol is up (connected)
Hardware is Gigabit Ethernet, address is 0023.5d08.5682 (bia 0023.5d08.5682)
Description: to new PC
MTU 1504 bytes, BW 1000000 Kbit, DLY 10 usec,
reliability 255/255, txload 1/255, rxload 1/255
Encapsulation ARPA, loopback not set
Keepalive set (10 sec)
Full-duplex, 1000Mb/s, media type is 10/100/1000BaseTX
input flow-control is off, output flow-control is unsupported
ARP type: ARPA, ARP Timeout 04:00:00
Last input never, output 00:00:00, output hang never
Last clearing of "show interface" counters 03:55:56
Input Queue: 0/75/0/0 (size/max/drops/flushes); Total output drops: 74855
Queueing strategy: fifo
Output queue: 0/40 (size/max)
5 minute input rate 107000 bits/sec, 9 packets/sec
5 minute output rate 1233000 bits/sec, 2411 packets/sec
439536 packets input, 85060088 bytes, 0 no buffer
Received 343 broadcasts (28 multicasts)
0 runts, 0 giants, 0 throttles
0 input errores, 0 CRC, 0 frame, 0 overrun, 0 ignored
0 watchdog, 28 multicast, 0 pause input
0 input packets with dribble condition detected
--More--
Switch# clear counters
Clear "show interface" counters on all interfaces [confirm]
Switch#
![]() Next, you contact the user and ask whether the problem is occurring. The user reports that the problem is occurring right at that moment. You use the show interface command again and see that the counters increase, meaning that some packets are being sent and received. You tend to think about a cabling issue, but it is not likely that all users all of a sudden have bad cables. Just to be sure, you replace the cable, but the problem remains, as expected.
Next, you contact the user and ask whether the problem is occurring. The user reports that the problem is occurring right at that moment. You use the show interface command again and see that the counters increase, meaning that some packets are being sent and received. You tend to think about a cabling issue, but it is not likely that all users all of a sudden have bad cables. Just to be sure, you replace the cable, but the problem remains, as expected.
![]() The problems were reported after a security update, although the problem is intermittent; however, a problem caused by security policy would be consistent. After eliminating Layer 1 as a possible problem cause, you move on to Layer 2 and continue researching by checking the user’s VLAN using the show vlan command, as demonstrated in Example 7-40. The user is in VLAN 10.
The problems were reported after a security update, although the problem is intermittent; however, a problem caused by security policy would be consistent. After eliminating Layer 1 as a possible problem cause, you move on to Layer 2 and continue researching by checking the user’s VLAN using the show vlan command, as demonstrated in Example 7-40. The user is in VLAN 10.
VLAN Name Status Ports
—— ————————————— ————— ———————————————
1 default active Gi0/1, Gi0/4, Gi0/6, Gi0/7
Gi0/8, Gi0/10, Gi0/18, Gi0/24
Gi0/25, Gi0/26, Gi0/27, Gi0/28
3 VLAN0003 active
6 VLAN0006 active
8 VLAN0008 active
9 VLAN0009 active
10 VLAN0010 active Gi0/2, Gi0/9, Gi0/11, Gi0/12
Gi0/13, Gi0/22
11 VLAN0011 active
12 VLAN0012 active
14 VLAN0014 active
20 VLAN0020 active Gi0/21
34 VLAN0034 active
50 VLAN0050 act/unsup Gi0/3, Gi0/5, Gi0/17, Gi0/19
Gi0/20, Gi0/23
63 VLAN0063 active
99 VLAN0099 active
543 VLAN0543 active
1002 fddi-default active
Switch#
![]() Next, knowing that security policies can be implemented at Layer 2 using VLAN filters, you check if a VLAN filter is applied to VLAN 10. The show vlan filter vlan 10 command output (shown in Example 7-41) reveals that a filter called VLAN10_OUT is applied to VLAN 10. Naturally, you display this filter using the show vlan access-map VLAN10_OUT command, so you can analyze it.
Next, knowing that security policies can be implemented at Layer 2 using VLAN filters, you check if a VLAN filter is applied to VLAN 10. The show vlan filter vlan 10 command output (shown in Example 7-41) reveals that a filter called VLAN10_OUT is applied to VLAN 10. Naturally, you display this filter using the show vlan access-map VLAN10_OUT command, so you can analyze it.
vlan 10 has filter VLAN10_OUT
Switch#
Switch# sh vlan access-map VLAN10_OUT
Vlan access-map "VLAN10_OUT" 10
Match clauses:
ip address: VLAN10_OUT
Action:
forward
Vlan access-map "VLAN10_OUT" 20
Match clauses:
ip address: VLAN11_OUT
Action:
forward
Vlan access-map "VLAN10_OUT" 30
Match clauses:
ip address: VLAN12_OUT VLAN13_OUT VLAN14_OUT VLAN15_OUT
Action:
forward
Switch#
![]() You can see that all of the access maps match on IP address, so this would not have an effect on Layer 1 or 2. To be sure, display one of these access lists (see Example 7-42). You get overwhelmed to see that the access list has more than 400 entries! The situation is made worse by the fact that several access lists are referenced for the packets going into or out of this VLAN.
You can see that all of the access maps match on IP address, so this would not have an effect on Layer 1 or 2. To be sure, display one of these access lists (see Example 7-42). You get overwhelmed to see that the access list has more than 400 entries! The situation is made worse by the fact that several access lists are referenced for the packets going into or out of this VLAN.
Extended IP access list VLAN10_OUT
2 permit tcp 10.1.20.0 0.0.0.255 host 10.10.50.124 eq domain
10 permit tcp 10.1.1.0 0.0.0.255 host 10.10.150.24 eq www
11 permit tcp 10.1.1.0 0.0.0.255 host 10.10.151.24 eq www
20 permit tcp 10.1.1.0 0.0.0.255 host 10.10.150.24 eq 22
21 permit tcp 10.1.1.0 0.0.0.255 host 10.10.151.24 eq 22
30 permit tcp 10.1.1.0 0.0.0.255 host 10.10.150.24 eq telnet
31 permit tcp 10.1.1.0 0.0.0.255 host 10.10.151.24 eq telnet
40 permit tcp 10.1.1.0 0.0.0.255 host 10.10.150.24 eq 443
41 permit tcp 10.1.1.0 0.0.0.255 host 10.10.151.24 eq 443
50 permit udp 10.1.1.0 0.0.0.255 host 10.10.150.24 eq snmp
51 permit udp 10.1.1.0 0.0.0.255 host 10.10.151.24 eq snmp
60 permit udp 10.1.1.0 0.0.0.255 host 10.10.150.24 eq snmptrap
61 permit udp 10.1.1.0 0.0.0.255 host 10.10.151.24 eq snmptrap
70 permit tcp 10.1.1.0 0.0.0.255 host 10.10.150.24 eq ftp
71 permit tcp 10.1.1.0 0.0.0.255 host 10.10.151.24 eq ftp
80 permit tcp 10.1.1.0 0.0.0.255 host 10.10.150.24 eq ftp-data
81 permit tcp 10.1.1.0 0.0.0.255 host 10.10.151.24 eq ftp-data
90 permit tcp 10.1.1.0 0.0.0.255 host 10.10.150.24 eq domain
91 permit tcp 10.1.1.0 0.0.0.255 host 10.10.151.24 eq domain
100 permit tcp 10.1.1.0 0.0.0.255 host 10.10.150.99 eq domain
! Output omitted for brevity
3920 permit tcp 10.1.40.0 0.0.0.255 host 10.10.50.99 eq 90
3930 permit udp 10.1.40.0 0.0.0.255 host 10.10.50.99 eq snmp
3940 permit udp 10.1.40.0 0.0.0.255 host 10.10.50.99 eq snmptrap
3950 permit tcp 10.1.40.0 0.0.0.255 host 10.10.50.99 eq ftp
3960 permit tcp 10.1.40.0 0.0.0.255 host 10.10.50.99 eq ftp-data
3961 permit tcp any host 10.10.50.100 eq ftp-data
3962 permit tcp any host 10.10.50.100 eq ftp (730 matches
Switch#
![]() Next, check to see whether an IP access list is applied to the VLAN 10 interface, using the command show ip interface vlan 10. The output, shown in Example 7-43, reveals both an outgoing and an inbound access list VLAN10 applied to the VLAN 10 interface.
Next, check to see whether an IP access list is applied to the VLAN 10 interface, using the command show ip interface vlan 10. The output, shown in Example 7-43, reveals both an outgoing and an inbound access list VLAN10 applied to the VLAN 10 interface.
Vlan10 is up, line protocol is up
Internet address is 10.1.1.1/24
Broadcast address is 255.255.255.255
Address determined by nonvolatile memory
MTU is 1500 bytes
Helper address is not set
Directed broadcast forwarding is disabled
Outgoing access list is VLAN10
Inbound access list is VLAN10
Proxy ARP is enabled
Local Proxy ARP is disabled
Security level is default
Split horizon is enabled
ICMP redirects are always sent
ICMP unreachables are always sent
ICMP mask replies are never sent
IP fast switching is enabled
IP CEF switching is enabled
IP CEF switching turbo vector
IP Null turbo vector
IP multicast fast switching is enabled
IP multicast distributed fast switching is disabled
IP route-cache flags are Fast, CEF
--More--
![]() When you display access list VLAN 10, you observe a huge output similar to the output when you displayed access list VLAN10_OUT (see Example 7-44). You cannot help but to wonder if this access list is affecting switch performance so badly that users cannot connect.
When you display access list VLAN 10, you observe a huge output similar to the output when you displayed access list VLAN10_OUT (see Example 7-44). You cannot help but to wonder if this access list is affecting switch performance so badly that users cannot connect.
Extended IP access list VLAN10_OUT
10 permit tcp 10.1.1.0 0.0.0.255 host 10.10.50.24 eq www
11 permit tcp 10.1.1.0 0.0.0.255 host 10.10.151.24 eq www
20 permit tcp 10.1.1.0 0.0.0.255 host 10.10.50.24 eq 22
21 permit tcp 10.1.1.0 0.0.0.255 host 10.10.151.24 eq 22
30 permit tcp 10.1.1.0 0.0.0.255 host 10.10.50.24 eq telnet
31 permit tcp 10.1.1.0 0.0.0.255 host 10.10.151.24 eq telnet
40 permit tcp 10.1.1.0 0.0.0.255 host 10.10.50.24 eq 443
41 permit tcp 10.1.1.0 0.0.0.255 host 10.10.151.24 eq 443
50 permit udp 10.1.1.0 0.0.0.255 host 10.10.50.24 eq snmp
51 permit udp 10.1.1.0 0.0.0.255 host 10.10.151.24 eq snmp
60 permit udp 10.1.1.0 0.0.0.255 host 10.10.50.24 eq snmptrap
61 permit udp 10.1.1.0 0.0.0.255 host 10.10.151.24 eq snmptrap
70 permit tcp 10.1.1.0 0.0.0.255 host 10.10.50.24 eq ftp
71 permit tcp 10.1.1.0 0.0.0.255 host 10.10.151.24 eq ftp
80 permit tcp 10.1.1.0 0.0.0.255 host 10.10.50.24 eq ftp-data
81 permit tcp 10.1.1.0 0.0.0.255 host 10.10.151.24 eq ftp-data
90 permit tcp 10.1.1.0 0.0.0.255 host 10.10.50.24 eq domain
91 permit tcp 10.1.1.0 0.0.0.255 host 10.10.151.24 eq domain
100 permit tcp 10.1.1.0 0.0.0.255 host 10.10.50.99 eq domain
101 permit tcp 10.1.1.0 0.0.0.255 host 10.10.151.99 eq domain
110 permit tcp 10.1.1.0 0.0.0.255 host 10.10.50.99 eq 3389
111 permit tcp 10.1.1.0 0.0.0.255 host 10.10.151.99 eq 33894
120 permit tcp 10.1.1.0 0.0.0.255 host 10.10.50.99 eq 3114
121 permit tcp 10.1.1.0 0.0.0.255 host 10.10.151.99 eq 3114
130 permit tcp 10.1.1.0 0.0.0.255 host 10.10.50.99 eq 10000
131 permit tcp 10.1.1.0 0.0.0.255 host 10.10.151.99 eq 10000
140 permit tcp 10.1.1.0 0.0.0.255 host 10.10.50.99 eq 3124
141 permit tcp 10.1.1.0 0.0.0.255 host 10.10.151.99 eq 3124
150 permit tcp 10.1.1.0 0.0.0.255 host 10.10.50.99 eq www
151 permit tcp 10.1.1.0 0.0.0.255 host 10.10.151.99 eq www
160 permit tcp 10.1.1.0 0.0.0.255 host 10.10.50.99 eq 22
161 permit tcp 10.1.1.0 0.0.0.255 host 10.10.151.99 eq 22
170 permit tcp 10.1.1.0 0.0.0.255 host 10.10.50.99 eq telnet
171 permit tcp 10.1.1.0 0.0.0.255 host 10.10.151.99 eq telnet
180 permit tcp 10.1.1.0 0.0.0.255 host 10.10.50.99 eq 443
181 permit tcp 10.1.1.0 0.0.0.255 host 10.10.151.99 eq 443
190 permit udp 10.1.1.0 0.0.0.255 host 10.10.50.9
! Output omitted for brevity
![]() You know that access lists are managed by the TCAM. So, access list entries should not be managed by the CPU. However, if the TCAM is full, packets will be sent to the CPU for processing (punt). You can verify this using the show platform tcam utilization command. The results in Example 7-45 display the TCAM entries and utilization of these entries.
You know that access lists are managed by the TCAM. So, access list entries should not be managed by the CPU. However, if the TCAM is full, packets will be sent to the CPU for processing (punt). You can verify this using the show platform tcam utilization command. The results in Example 7-45 display the TCAM entries and utilization of these entries.
CAM utilization for ASIC# 0 Max Used
Masks/Values Masks/Values
Unicast mac addresses: 6364/6364 29/29
IPv4 IGMP groups + multicast routes: 1120/1120 1/1
IPv4 unicast directly-connected routes: 6144/6144 5/5
IPv4 unicast indirectly-connected routes: 2048/2048 39/39
IPv4 policy based routing aces: 452/452 12/12
IPv4 qos aces: 512/512 8/8
IPv4 security aces: 964/964 790/790
Note: Allocation of TCAM entries per feature uses
A complex algorithm. The above information is meant
To provide an abstract view of the current TCAM utilization
Switch#
![]() The IPv4 security access line is eye-catching. There are 964 slots, and 790 slots are in use. Checking the CPU utilization next, you find that it is very high (see Example 7-46). This indicates that the TCAM is sending packets to the CPU for processing, overloading the CPU as a result.
The IPv4 security access line is eye-catching. There are 964 slots, and 790 slots are in use. Checking the CPU utilization next, you find that it is very high (see Example 7-46). This indicates that the TCAM is sending packets to the CPU for processing, overloading the CPU as a result.
CPU utilization for five seconds: 98%/17%; one minute: 72%; five minutes: 30%
PID Runtime(ms) Invoked usecs 5Sec 1Min 5Min TTY Process
1 34 813 41 0.00% 0.00% 0.00% 0 Chunk Manager
2 32 4387 7 0.00% 0.00% 0.00% 0 Load Meter
3 0 1 0 0.00% 0.00% 0.00% 0 CEF RP IPC Backg
4 39508 3210 12307 1.75% 0.24% 0.14% 0 Check heaps
5 73 106 688 0.00% 0.00% 0.00% 0 Pool Manager
6 0 2 0 0.00% 0.00% 0.00% 0 Timers
7 0 1 0 0.00% 0.00% 0.00% 0 Image Licensing
8 0 2 0 0.00% 0.00% 0.00% 0 License Client N
9 8756 74 118324 0.00% 0.03% 0.02% 0 Licensing Auto U
10 0 1 0 0.00% 0.00% 0.00% 0 Crash writer
11 4158258 862519 4821 15.65% 14.81% 4.33% 0 ARP Input
12 0 1 0 0.00% 0.00% 0.00% 0 CEF MIB API
13 0 1 0 0.00% 0.00% 0.00% 0 AAA_SERVER_DEADT
14 0 2 0 0.00% 0.00% 0.00% 0 AAA high-capacit
15 0 1 0 0.00% 0.00% 0.00% 0 Policy Manager
16 0 6 1500 0.00% 0.00% 0.00% 0 Entity MIB API
17 0 1 0 0.00% 0.00% 0.00% 0 IFS Agent Manage
18 0 367 0 0.00% 0.00% 0.00% 0 IPC Dynamic Cach
19 0 1 0 0.00% 0.00% 0.00% 0 IPC Zone Manager
20 381 21700 17 0.00% 0.00% 0.00% 0 IPC Periodic Tim
![]() You have found the problem and its source. The solution, noting that this is an extreme example, is that you need to rewrite and simplify the access lists. Also, you need to verify whether the same VLAN access lists at both the VLAN level and the interface level are necessary. If the access lists cannot be simplified, it might be time to invest in a dedicated platform for security filtering of this network.
You have found the problem and its source. The solution, noting that this is an extreme example, is that you need to rewrite and simplify the access lists. Also, you need to verify whether the same VLAN access lists at both the VLAN level and the interface level are necessary. If the access lists cannot be simplified, it might be time to invest in a dedicated platform for security filtering of this network.
0 comments
Post a Comment