
 Troubleshooting Network Applications Services
![]() Cisco Application Networking Services (ANS) is a comprehensive portfolio of application networking solutions and technologies that enable successful and secure delivery of applications within data centers to local, remote, and branch-office users. Using technology to accelerate, secure, and increase availability of both application traffic and computing resources, Cisco ANS provides a comprehensive and application-adaptive set of solutions for meeting the core application challenges related to the network. Unlike application delivery point products that are focused on specific IT issues or places in the network, Cisco ANS consists of a broad portfolio of application networking platforms coupled with application fluency integrated into existing devices throughout the network, resulting in a truly end-to-end application delivery network. The topic of application-enabled networks is wide and includes everything from application acceleration services such as Wide Area Application Services (WAAS), to server load-balancing products such as Application Control Engine (ACE), and to monitoring and quality of service (QoS) mechanisms. Figure 7-1 shows the main categories of applications services.
Cisco Application Networking Services (ANS) is a comprehensive portfolio of application networking solutions and technologies that enable successful and secure delivery of applications within data centers to local, remote, and branch-office users. Using technology to accelerate, secure, and increase availability of both application traffic and computing resources, Cisco ANS provides a comprehensive and application-adaptive set of solutions for meeting the core application challenges related to the network. Unlike application delivery point products that are focused on specific IT issues or places in the network, Cisco ANS consists of a broad portfolio of application networking platforms coupled with application fluency integrated into existing devices throughout the network, resulting in a truly end-to-end application delivery network. The topic of application-enabled networks is wide and includes everything from application acceleration services such as Wide Area Application Services (WAAS), to server load-balancing products such as Application Control Engine (ACE), and to monitoring and quality of service (QoS) mechanisms. Figure 7-1 shows the main categories of applications services.


![]() The focus of this section is on Cisco IOS application services, and on network infrastructure services aimed at optimizing application traffic as it uses that infrastructure. This section also discusses some of the common issues with Cisco IOS application services, and it concludes with a troubleshooting example related to this topic.
The focus of this section is on Cisco IOS application services, and on network infrastructure services aimed at optimizing application traffic as it uses that infrastructure. This section also discusses some of the common issues with Cisco IOS application services, and it concludes with a troubleshooting example related to this topic.
Network Application Services
![]() The recipe to application optimization is a four-step cycle that incrementally increases your understanding of network applications and enables you to progressively deploy measurable improvements and adjustments as required; those steps are as follows:
The recipe to application optimization is a four-step cycle that incrementally increases your understanding of network applications and enables you to progressively deploy measurable improvements and adjustments as required; those steps are as follows:
![]() Figure 7-2 shows the four-step application optimization cycle with the relevant Cisco IOS tools mentioned beside each step.
Figure 7-2 shows the four-step application optimization cycle with the relevant Cisco IOS tools mentioned beside each step.


![]() The focus of this section is on Cisco IOS tools that mostly serve the purpose of baselining application traffic. The profile of a network describes the traffic patterns and resource bottlenecks of a network, and it identifies the links and protocols that are the best candidates for optimization. Through profiling, a network engineer can focus on only those network components whose optimization will help improve network performance. This way, baselines become performance benchmarks. Baselining is also the establishment of acceptable network behavior, which includes the following:
The focus of this section is on Cisco IOS tools that mostly serve the purpose of baselining application traffic. The profile of a network describes the traffic patterns and resource bottlenecks of a network, and it identifies the links and protocols that are the best candidates for optimization. Through profiling, a network engineer can focus on only those network components whose optimization will help improve network performance. This way, baselines become performance benchmarks. Baselining is also the establishment of acceptable network behavior, which includes the following:
- Understanding available bandwidth
- Identifying a normal pattern of network behavior such as network delays and what applications are running on the network
- Understanding the behavior (and requirements) of each application on the network
- Measuring application response times
![]() Network administrators need to know the acceptable range for network performance before they can make reliable conclusions about possible performance degradation. With proper baselining, administrators can differentiate between consistent network behavior and anomalous network behavior.
Network administrators need to know the acceptable range for network performance before they can make reliable conclusions about possible performance degradation. With proper baselining, administrators can differentiate between consistent network behavior and anomalous network behavior.
![]() The sections that follow provide a brief discussion on the following Cisco IOS application optimization tools:
The sections that follow provide a brief discussion on the following Cisco IOS application optimization tools:
![]() Some of them, such as NetFlow, IP SLAs, and NBAR packet inspection, provide a good starting point for creating a network performance baseline. Because these tools are capable of classifying and characterizing traffic, you can use them to also measure the effect of the optimization technologies. Some others, such as Cisco IOS SLB, are actual optimization techniques that will improve the scalability of applications. Given its integration into Cisco IOS, the SLB capability is appropriate for scenarios with smaller traffic volumes; this is also the case for the Cisco AutoQoS feature.
Some of them, such as NetFlow, IP SLAs, and NBAR packet inspection, provide a good starting point for creating a network performance baseline. Because these tools are capable of classifying and characterizing traffic, you can use them to also measure the effect of the optimization technologies. Some others, such as Cisco IOS SLB, are actual optimization techniques that will improve the scalability of applications. Given its integration into Cisco IOS, the SLB capability is appropriate for scenarios with smaller traffic volumes; this is also the case for the Cisco AutoQoS feature.
NetFlow
![]() NetFlow efficiently provides a vital set of services for IP applications, including the following:
NetFlow efficiently provides a vital set of services for IP applications, including the following:
- Network traffic accounting
- Usage-based network billing
- Network planning
- Security denial-of-service monitoring
- Overall network monitoring
![]() Designed by Cisco, NetFlow is now in its ninth version, which is now on the IETF standards track to become an industrywide standard. Similar to what is shown on Figure 7-3, NetFlow works by creating a NetFlow cache that will hold information for all active flows.
Designed by Cisco, NetFlow is now in its ninth version, which is now on the IETF standards track to become an industrywide standard. Similar to what is shown on Figure 7-3, NetFlow works by creating a NetFlow cache that will hold information for all active flows.

![]() A flow is a unidirectional stream of packets, between a given source and a destination, that have several components in common. The seven fields that need to match for packets to be considered part of the same flow are as follows:
A flow is a unidirectional stream of packets, between a given source and a destination, that have several components in common. The seven fields that need to match for packets to be considered part of the same flow are as follows:
- Source IP Address
- Destination IP Address
- Source Port (protocol dependent)
- Destination Port (protocol dependent)
- Protocol (Layer 3 or 4)
- Type of Service (ToS) Value (differentiated services code point [DSCP])
- Input interface
![]() The NetFlow cache will eventually grow so large that it could exhaust the resources of the router; however, you can push information periodically to a NetFlow Collector, effectively exporting the information and allowing for offline analysis. Therefore, the NetFlow cache entries can simply expire and be removed from the router, which in turn can gather more flow information and fill up the table again.
The NetFlow cache will eventually grow so large that it could exhaust the resources of the router; however, you can push information periodically to a NetFlow Collector, effectively exporting the information and allowing for offline analysis. Therefore, the NetFlow cache entries can simply expire and be removed from the router, which in turn can gather more flow information and fill up the table again.
![]() Configuring NetFlow is straightforward. The first thing you need to do is enable it on a per-interface basis using the command ip flow ingress. This command actually enables NetFlow accounting on that interface for ingress traffic. If you want to export the NetFlow cache entries to an external collector, you must define the version and the destination IP address and the UDP port number as demonstrated in Example 7-1. Optionally, you can also configure cache timeouts and size, and how you want to aggregate the data.
Configuring NetFlow is straightforward. The first thing you need to do is enable it on a per-interface basis using the command ip flow ingress. This command actually enables NetFlow accounting on that interface for ingress traffic. If you want to export the NetFlow cache entries to an external collector, you must define the version and the destination IP address and the UDP port number as demonstrated in Example 7-1. Optionally, you can also configure cache timeouts and size, and how you want to aggregate the data.
Router(config-if)# exit
Router(config)# ip flow-export version 9
Router(config)# ip flow-export destination 1.1.1.1 9991
Router(config)# end
![]() You can display the NetFlow statistics with the show ip cache flow command, as demonstrated in Example 7-2. You can see information on packet size distribution, which is important in baselining your network traffic, and see summary information regarding the number of flows, aging timers, and other statistics such as packet rates.
You can display the NetFlow statistics with the show ip cache flow command, as demonstrated in Example 7-2. You can see information on packet size distribution, which is important in baselining your network traffic, and see summary information regarding the number of flows, aging timers, and other statistics such as packet rates.
IP packet size distribution (85435 total packets):
! Packet Sizes
1-32 64 96 128 160 192 224 256 288 320 352 384 416 448 480
.000 .000 .000 .000 000 .000 .000 .000 .000 .000 .000 .000 .000 .000 .000
512 544 576 1024 1536 2048 2560 3072 3584 4096 4608
.000 .000 .000 .000 1.00 .000 .000 .000 .000 .000 .000
IP Flow Switching Cache, 278544 bytes
! Number of Active Flows
2728 active, 1638 inactive, 85310 added
463824 ager polls, 0 flow alloc failures
Active flows timeout in 30 minutes
Inactive flows timeout in 15 seconds
last clearing of statistics never
! Rates and Duration
Protocol Total Flows Packets Bytes Packets Active (Sec) Idle (Sec)
———— Flows /Sec /Flow /Pkt /Sec /Flow /Flow
TCP-X 2 0.0 1 1440 11.2 0.0 9.5
TCP-other 82580 11.2 1 1440 11.2 0.0 12.0
Total 82582 11.2 1 1440 11.2 0.0 12.0
! Flow Details Cache
SrcIF SrcIPaddress DstIf DstIPaddress Pr SrcP DstP Pkts
Et0/0 132.122.25.60 Se0/0 192.168.1.1 06 9AEE 0007 1
Et0/0 139.57.220.28 Se0/0 192.168.1.1 06 708D 0007 1
Et0/0 165.172.153.65 Se0/0 192.168.1.1 06 CB46 0007 1
![]() Arguably, the most important part of the show ip cache flow command output is the actual flow information. Notice that you can not only see the main flow parameters, such as source and destination IP addresses and ports, but you can also see volume and performance information such as total number of flows, flows per second, bytes and packets per second, and so on. In the flow collector, you can aggregate this data, manipulate it and graph it, and build effective baseline information for your network.
Arguably, the most important part of the show ip cache flow command output is the actual flow information. Notice that you can not only see the main flow parameters, such as source and destination IP addresses and ports, but you can also see volume and performance information such as total number of flows, flows per second, bytes and packets per second, and so on. In the flow collector, you can aggregate this data, manipulate it and graph it, and build effective baseline information for your network.
Cisco IP SLA
![]() The IP SLA feature of Cisco IOS Software enables you to configure a router to send synthetic (generated) traffic to a host computer or router that has been configured to respond. One-way or return travel times and packet loss data are gathered and certain measurements allow jitter data to be collected, too. You can run multiple IP SLA probes at the same time, and customize the nature of the probe by selecting ports and traffic characteristics, packet sizes, frequency and timeouts for the probe, and many other parameters. Figure 7-4 shows an IOS router that has IP SLA enabled, performing hop-by-hop analysis, end-to-end measurements, and proactive notification (Simple Network Management Protocol [SNMP] traps) when rising and falling thresholds are crossed.
The IP SLA feature of Cisco IOS Software enables you to configure a router to send synthetic (generated) traffic to a host computer or router that has been configured to respond. One-way or return travel times and packet loss data are gathered and certain measurements allow jitter data to be collected, too. You can run multiple IP SLA probes at the same time, and customize the nature of the probe by selecting ports and traffic characteristics, packet sizes, frequency and timeouts for the probe, and many other parameters. Figure 7-4 shows an IOS router that has IP SLA enabled, performing hop-by-hop analysis, end-to-end measurements, and proactive notification (Simple Network Management Protocol [SNMP] traps) when rising and falling thresholds are crossed.


![]() IP SLA is useful for performance measurement, monitoring, and network baselining. You can tie the results of the IP SLA operations to other features of your router, and trigger action based on the results of the probe. For example, you can enable a path to a specific destination to be inserted into the routing table only if the IP SLA probe succeeds in reaching a host in that destination on a specific port. You can use IP SLA operations to monitor the performance of any area in the network without deploying a physical probe. An IP SLA operation uses generated traffic to measure network performance between two networking devices.
IP SLA is useful for performance measurement, monitoring, and network baselining. You can tie the results of the IP SLA operations to other features of your router, and trigger action based on the results of the probe. For example, you can enable a path to a specific destination to be inserted into the routing table only if the IP SLA probe succeeds in reaching a host in that destination on a specific port. You can use IP SLA operations to monitor the performance of any area in the network without deploying a physical probe. An IP SLA operation uses generated traffic to measure network performance between two networking devices.
![]() Figure 7-4 shows that a device sends a generated packet to the destination device, which is configured as a responder. After the destination device receives the packet, depending on the type of IP SLA operation, it responds with time-stamp information for the source to make the calculation on performance metrics. An IP SLA operation performs a network measurement from the source device to a destination in the network using a specific protocol such as User Datagram Protocol (UDP). When you configure an IP SLA operation, you must schedule the operation to begin capturing statistics and collecting error information. You can schedule an operation to start immediately or to start at a certain month, day, and hour. To implement IP SLA network performance measurement, you need to perform the following tasks:
Figure 7-4 shows that a device sends a generated packet to the destination device, which is configured as a responder. After the destination device receives the packet, depending on the type of IP SLA operation, it responds with time-stamp information for the source to make the calculation on performance metrics. An IP SLA operation performs a network measurement from the source device to a destination in the network using a specific protocol such as User Datagram Protocol (UDP). When you configure an IP SLA operation, you must schedule the operation to begin capturing statistics and collecting error information. You can schedule an operation to start immediately or to start at a certain month, day, and hour. To implement IP SLA network performance measurement, you need to perform the following tasks:
- Enable the IP SLA responder, if required.
- Configure the required IP SLA operation type.
- Configure any options available for the specified operation type.
- Configure threshold conditions, if required.
- Schedule the operation to run, and then let the operation run for a period of time to gather statistics.
- Display and interpret the results of the operation using the Cisco IOS command-line interface (CLI) or a network management system (NMS) with SNMP
![]() Example 7-3 shows an IP SLA configuration on a router. The first thing you do is define the operation identifier; in the example, the SLA monitor operation identifier is 1. Then you enter the IP SLA configuration mode and define the type of operation. There are several operation types available, a few examples of which are dhcp, dns, echo, framerelay, ftp, http, path-echo, path-jitter, slm, tcp-connect, udp-echo, and voip. There are several rich options, from basic echo operations to more complex application layer probes that let you define the type of application layer information you want to send such as HTTP URLs, TCP and UDP ports, and others. Example 7-3 uses echo protocol ipIcmpEcho to address 10.32.130.2. This example also defines the frequency to be every 120 seconds and the value of ToS to be 32 (32 is 00100000 in binary and equivalent to IP precedence 1 or DSCP CS1). The configuration in Example 7-3 schedules IP SLA to run forever, starting now. You can also configure specific dates and times and a specific duration of the probe.
Example 7-3 shows an IP SLA configuration on a router. The first thing you do is define the operation identifier; in the example, the SLA monitor operation identifier is 1. Then you enter the IP SLA configuration mode and define the type of operation. There are several operation types available, a few examples of which are dhcp, dns, echo, framerelay, ftp, http, path-echo, path-jitter, slm, tcp-connect, udp-echo, and voip. There are several rich options, from basic echo operations to more complex application layer probes that let you define the type of application layer information you want to send such as HTTP URLs, TCP and UDP ports, and others. Example 7-3 uses echo protocol ipIcmpEcho to address 10.32.130.2. This example also defines the frequency to be every 120 seconds and the value of ToS to be 32 (32 is 00100000 in binary and equivalent to IP precedence 1 or DSCP CS1). The configuration in Example 7-3 schedules IP SLA to run forever, starting now. You can also configure specific dates and times and a specific duration of the probe.
Router# configure terminal
Router(config)# ip sla monitor 1
Router(config-sla-monitor)# type echo protocol ipIcmpEcho 10.32.130.2
Router(config-sla-monitor-echo)# frequency 120
Router(config-sla-monitor-echo)# tos 32
Router(config-sla-monitor-echo)# exit
Router(config)# ip sla monitor schedule 1 start-time now life forever
Router(config)# exit
![]() Depending on the type of probe you set up, you might or might not need to configure an IP SLA responder. For example, if you are setting up a simple echo probe, you do not need a responder. If the echo packet comes back, it means success. The echo packet targets an IP address. Success means that the IP address is live in the network and is able to respond. It also means that there is reachability to it.
Depending on the type of probe you set up, you might or might not need to configure an IP SLA responder. For example, if you are setting up a simple echo probe, you do not need a responder. If the echo packet comes back, it means success. The echo packet targets an IP address. Success means that the IP address is live in the network and is able to respond. It also means that there is reachability to it.
![]() The Cisco IOS IP SLA Responder is a component embedded in the destination Cisco routing device that allows the system to anticipate and respond to Cisco IOS IP SLAs request packets. The Cisco IOS IP SLA Responder provides an enormous advantage with accurate measurements without the need for dedicated probes and additional statistics not available via standard ICMP-based measurements. The patented Cisco IOS IP SLA Control Protocol is used by the Cisco IOS IP SLA Responder, providing a mechanism through which the responder can be notified on which port it should listen and respond. Only a Cisco IOS device can be a source for a destination IP SLA Responder. The Cisco IOS IP SLA Responder listens on a specific port for control protocol messages sent by a Cisco IOS IP SLA’s operation. Upon receipt of the control message, the responder will enable the specified UDP or TCP port for the specified duration. During this time, the responder accepts the requests and responds to them. The responder disables the port after it responds to the Cisco IOS IP SLA’s packet, or when the specified time expires. For added security, Message Digest 5 (MD5) authentication for control messages is available.
The Cisco IOS IP SLA Responder is a component embedded in the destination Cisco routing device that allows the system to anticipate and respond to Cisco IOS IP SLAs request packets. The Cisco IOS IP SLA Responder provides an enormous advantage with accurate measurements without the need for dedicated probes and additional statistics not available via standard ICMP-based measurements. The patented Cisco IOS IP SLA Control Protocol is used by the Cisco IOS IP SLA Responder, providing a mechanism through which the responder can be notified on which port it should listen and respond. Only a Cisco IOS device can be a source for a destination IP SLA Responder. The Cisco IOS IP SLA Responder listens on a specific port for control protocol messages sent by a Cisco IOS IP SLA’s operation. Upon receipt of the control message, the responder will enable the specified UDP or TCP port for the specified duration. During this time, the responder accepts the requests and responds to them. The responder disables the port after it responds to the Cisco IOS IP SLA’s packet, or when the specified time expires. For added security, Message Digest 5 (MD5) authentication for control messages is available.
![]() If you need to configure IP SLA responder, you must use the ip sla responder command and specify the IP address and port that will be used to respond. The complete syntax of that command is as follows:
If you need to configure IP SLA responder, you must use the ip sla responder command and specify the IP address and port that will be used to respond. The complete syntax of that command is as follows:
ip sla responder {tcp-connect | udp-echo} ipaddress ip-address port port-number
![]() After an IP SLA responder is also configured, you can use the show ip sla responder command to display information about recent sources of IP SLA control messages, such as who has sent recent control messages and who has sent invalid control messages.
After an IP SLA responder is also configured, you can use the show ip sla responder command to display information about recent sources of IP SLA control messages, such as who has sent recent control messages and who has sent invalid control messages.
NBAR
![]() Network-Based Application Recognition (NBAR) is another important tool for baselining and traffic-classification purposes. NBAR is a classification engine that recognizes a wide variety of applications, including web-based and other difficult-to-classify protocols that use dynamic TCP/UDP port assignments. If an application is recognized and classified by NBAR, the network can invoke services for that specific application. NBAR can be used to ensure that network bandwidth is used efficiently by classifying packets, and then applying QoS to the classified traffic. NBAR can also be used to identify malicious or unwanted traffic and block or filter it. When you use the match protocol command inside a route map, you are identifying the application using NBAR. If a packet matches a particular application, you can then do things like mark those packets with particular DSCP values, rate-limit those packets, or simply drop them.
Network-Based Application Recognition (NBAR) is another important tool for baselining and traffic-classification purposes. NBAR is a classification engine that recognizes a wide variety of applications, including web-based and other difficult-to-classify protocols that use dynamic TCP/UDP port assignments. If an application is recognized and classified by NBAR, the network can invoke services for that specific application. NBAR can be used to ensure that network bandwidth is used efficiently by classifying packets, and then applying QoS to the classified traffic. NBAR can also be used to identify malicious or unwanted traffic and block or filter it. When you use the match protocol command inside a route map, you are identifying the application using NBAR. If a packet matches a particular application, you can then do things like mark those packets with particular DSCP values, rate-limit those packets, or simply drop them.
![]() There is a long list of applications identified by NBAR. At one point, the number of applications and protocols supported by NBAR exceeded 90. Those applications and protocols include those that use static ports, those that use dynamic ports, and even the non-UDP and non-TCP-based ones. Traditionally, routers have not been able to recognize many applications by just inspecting the Layer 3 and Layer 4 headers. NBAR performs deep packet inspection up to the application layer for traffic classification. When enabled, NBAR reads into the payload of the packet and can identify application layer components, such as negotiated ports.
There is a long list of applications identified by NBAR. At one point, the number of applications and protocols supported by NBAR exceeded 90. Those applications and protocols include those that use static ports, those that use dynamic ports, and even the non-UDP and non-TCP-based ones. Traditionally, routers have not been able to recognize many applications by just inspecting the Layer 3 and Layer 4 headers. NBAR performs deep packet inspection up to the application layer for traffic classification. When enabled, NBAR reads into the payload of the packet and can identify application layer components, such as negotiated ports.
| Note |
|
![]() The simplest use of NBAR is baselining through protocol discovery. Use the interface configuration command ip nbar protocol-discovery to gather information about the applications known to NBAR that are transiting an interface. NBAR can also be used to plan your QoS deployment or simply to understand the type of traffic lurking around your network. Using NBAR protocol discovery is simple—After your enable it on an interface, you can use the show ip nbar protocol-discovery command to look at application statistics at any point during your analysis. Example 7-4 demonstrates sample output from this command. The packet count, byte count, and bit rate statistics for both input and output traffic for each application are displayed. These are useful variables in capacity planning, security, and QoS design.
The simplest use of NBAR is baselining through protocol discovery. Use the interface configuration command ip nbar protocol-discovery to gather information about the applications known to NBAR that are transiting an interface. NBAR can also be used to plan your QoS deployment or simply to understand the type of traffic lurking around your network. Using NBAR protocol discovery is simple—After your enable it on an interface, you can use the show ip nbar protocol-discovery command to look at application statistics at any point during your analysis. Example 7-4 demonstrates sample output from this command. The packet count, byte count, and bit rate statistics for both input and output traffic for each application are displayed. These are useful variables in capacity planning, security, and QoS design.
FastEthernet6/0
Input Output
Protocol Packet Count Packet Count
Byte Count Byte Count
5 minute bit rate (bps) 5 minute bit rate (bps)
——————— ———————————— ————————————
RTP 279538 14644
! Packet Count
319106191 673624
! Byte Count
0 0
...
Total 17203819 151684936
19161397327 50967034611
4179000 6620000
![]() Because NBAR depends on Cisco Express Forwarding (CEF), it does not cause huge performance degradation on the routers; however, NBAR can only be used to classify packets of known applications. Therefore, there is a finite list of supported applications that NBAR knows and can analyze. To be able to match more protocols and applications that the base IOS NBAR feature supports, you need to upload Packet Description Language Modules (PDLMs). PDLMs allow NBAR to recognize new protocols without requiring a new Cisco IOS image or a router reload. PDLMs contain the rules that are used by NBAR to recognize an application and can be used to bring new or changed functionality to NBAR. You can load an external PDLM at runtime to extend the NBAR list of recognized protocols and enhance NBAR’s existing protocol recognition capability. After you copy a PDLM from Cisco.com into your router’s flash memory, you can load it using this command: ip nbar pdlm flash://pdlm-name. Currently available PDLMs support Citrix ICA (Independent Computing Architecture) and peer-to-peer file-sharing applications such as KaZaa2, Gnutella, BitTorrent, eDonkey2000, and WinMX.
Because NBAR depends on Cisco Express Forwarding (CEF), it does not cause huge performance degradation on the routers; however, NBAR can only be used to classify packets of known applications. Therefore, there is a finite list of supported applications that NBAR knows and can analyze. To be able to match more protocols and applications that the base IOS NBAR feature supports, you need to upload Packet Description Language Modules (PDLMs). PDLMs allow NBAR to recognize new protocols without requiring a new Cisco IOS image or a router reload. PDLMs contain the rules that are used by NBAR to recognize an application and can be used to bring new or changed functionality to NBAR. You can load an external PDLM at runtime to extend the NBAR list of recognized protocols and enhance NBAR’s existing protocol recognition capability. After you copy a PDLM from Cisco.com into your router’s flash memory, you can load it using this command: ip nbar pdlm flash://pdlm-name. Currently available PDLMs support Citrix ICA (Independent Computing Architecture) and peer-to-peer file-sharing applications such as KaZaa2, Gnutella, BitTorrent, eDonkey2000, and WinMX.
| Note |
|
SLB
![]() The Cisco IOS server load balancing (SLB) feature allows you to define a virtual server that represents a cluster of real servers, known as a server farm. When a client initiates a connection to the virtual server, the Cisco IOS SLB load balances the connection to a chosen real server based on the configured load-balance algorithm or predictor. Clients initiate their connections to a virtual IP address (VIP), which is configured at the load balancer and represents the servers of the server farm (see Figure 7-5).
The Cisco IOS server load balancing (SLB) feature allows you to define a virtual server that represents a cluster of real servers, known as a server farm. When a client initiates a connection to the virtual server, the Cisco IOS SLB load balances the connection to a chosen real server based on the configured load-balance algorithm or predictor. Clients initiate their connections to a virtual IP address (VIP), which is configured at the load balancer and represents the servers of the server farm (see Figure 7-5).
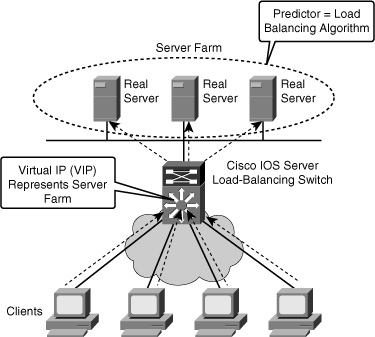
![]() This solution not only adds optimization by balancing the load across multiple servers, but it also provides scalability. If you need more capacity, you just add more servers, and the solution remains transparent to clients. They will still point to the VIP to reach the server farm. This results in operational efficiencies, too. If you need to remove a server or put it out of rotation for maintenance purposes, you simply remove it from the server farm, and transparency is still maintained. Clients will still point to the VIP; what happens inside the server farm is transparent to them.
This solution not only adds optimization by balancing the load across multiple servers, but it also provides scalability. If you need more capacity, you just add more servers, and the solution remains transparent to clients. They will still point to the VIP to reach the server farm. This results in operational efficiencies, too. If you need to remove a server or put it out of rotation for maintenance purposes, you simply remove it from the server farm, and transparency is still maintained. Clients will still point to the VIP; what happens inside the server farm is transparent to them.
QoS and AutoQoS
![]() One of the building blocks of QoS is traffic classification and NBAR is an excellent traffic-classification tool. Within the framework of QoS, each traffic class is treated differently by the network, with different methods of congestion management, congestion avoidance, policing, and other policies. Cisco AutoQoS is an automation tool for deploying QoS policies. The newer versions of Cisco AutoQoS have two phases. In the first phase, information is gathered and traffic is baselined to define traffic classes and volumes; this is called autodiscovery. You enter the auto discovery qos command in the interface configuration mode. You must let discovery run for a period of time appropriate for your baselining or monitoring needs, with 3 days to 2 weeks being the usual range. The router collects information on traffic metrics, using NBAR to classify and identify the traffic at the application layer. During the process, you can view the data collection in progress using the show auto discovery qos command. Figure 7-6 demonstrates sample output from this command. In the second phase you enter the auto qos command, which is also an interface configuration mode command. This command uses the information gathered by autodiscovery in phase one to apply QoS policies accordingly. The autodiscovery phase generates templates on the basis of the data collected. These templates are then used to create QoS policies. It is in the second phase that these policies are installed by AutoQoS on the interface.
One of the building blocks of QoS is traffic classification and NBAR is an excellent traffic-classification tool. Within the framework of QoS, each traffic class is treated differently by the network, with different methods of congestion management, congestion avoidance, policing, and other policies. Cisco AutoQoS is an automation tool for deploying QoS policies. The newer versions of Cisco AutoQoS have two phases. In the first phase, information is gathered and traffic is baselined to define traffic classes and volumes; this is called autodiscovery. You enter the auto discovery qos command in the interface configuration mode. You must let discovery run for a period of time appropriate for your baselining or monitoring needs, with 3 days to 2 weeks being the usual range. The router collects information on traffic metrics, using NBAR to classify and identify the traffic at the application layer. During the process, you can view the data collection in progress using the show auto discovery qos command. Figure 7-6 demonstrates sample output from this command. In the second phase you enter the auto qos command, which is also an interface configuration mode command. This command uses the information gathered by autodiscovery in phase one to apply QoS policies accordingly. The autodiscovery phase generates templates on the basis of the data collected. These templates are then used to create QoS policies. It is in the second phase that these policies are installed by AutoQoS on the interface.


![]() In the output of the discovery phase, as you can see in Figure 7-6, traffic is defined into traffic classes. An interesting discovery is the VoIP traffic class and the Real-Time Transport Protocol (RTP). According to traffic volumes, a full definition of bandwidth reservation and queuing is also shown. Note that this definition of policy is applied only when you actually deploy Cisco AutoQoS during the second phase. You can display the AutoQoS generated commands using show auto qos. Be sure to back up your router configuration before you implement AutoQoS, and be ready to escalate to a QoS specialist for advanced troubleshooting. For Cisco AutoQoS to work, routers must meet the following requirements:
In the output of the discovery phase, as you can see in Figure 7-6, traffic is defined into traffic classes. An interesting discovery is the VoIP traffic class and the Real-Time Transport Protocol (RTP). According to traffic volumes, a full definition of bandwidth reservation and queuing is also shown. Note that this definition of policy is applied only when you actually deploy Cisco AutoQoS during the second phase. You can display the AutoQoS generated commands using show auto qos. Be sure to back up your router configuration before you implement AutoQoS, and be ready to escalate to a QoS specialist for advanced troubleshooting. For Cisco AutoQoS to work, routers must meet the following requirements:
- CEF must be enabled on the interface.
- The interface (or subinterface) must have an IP address configured.
- For serial interfaces (or subinterfaces), the appropriate bandwidth must be configured.
- On point-to-point serial interfaces, both sides must have AutoQos configured.
- The interface should not have any prior QoS configurations.
Common Issues with Network Application Services
![]() This section briefly presents the main issues with the network application services discussed in the previous section, namely NetFlow, IP SLA, NBAR, SLB, QoS, and AutoQoS. Some of these tools, such as NBAR, NetFlow, and IP SLA, are used for baselining and monitoring, and some of them, such as SLB and QoS, are optimization techniques.
This section briefly presents the main issues with the network application services discussed in the previous section, namely NetFlow, IP SLA, NBAR, SLB, QoS, and AutoQoS. Some of these tools, such as NBAR, NetFlow, and IP SLA, are used for baselining and monitoring, and some of them, such as SLB and QoS, are optimization techniques.
Common NetFlow Issues
![]() In the case of NetFlow, the most common issues can be categorized as being related to performance and the exporting process. As efficient as NetFlow is in exporting aggregated information to a NetFlow Analyzer server, you might need to tune it so that it does not create performance degradation in the NetFlow-enabled device by consuming too much memory or CPU cycles. You might have to set limits to the number of entries in the cache, or tune the aging timers of NetFlow. Aging timers define how long a flow remains in the cache before being timed out and exported. If the aging timers are too high, the table can remain full continuously. If the NetFlow table reaches capacity, it starts dropping the oldest flows first. Export problems, on the other hand, are typically based on configuration errors or reachability to the NetFlow Collector or server. The following are some of the common NetFlow export culprits:
In the case of NetFlow, the most common issues can be categorized as being related to performance and the exporting process. As efficient as NetFlow is in exporting aggregated information to a NetFlow Analyzer server, you might need to tune it so that it does not create performance degradation in the NetFlow-enabled device by consuming too much memory or CPU cycles. You might have to set limits to the number of entries in the cache, or tune the aging timers of NetFlow. Aging timers define how long a flow remains in the cache before being timed out and exported. If the aging timers are too high, the table can remain full continuously. If the NetFlow table reaches capacity, it starts dropping the oldest flows first. Export problems, on the other hand, are typically based on configuration errors or reachability to the NetFlow Collector or server. The following are some of the common NetFlow export culprits:
- A destination IP address has not been configured.
- A source interface has not been configured.
- A source interface has been configured, but does not have an IPv4 address.
- A source interface has been configured, but it is not in the up state.
- The subnet of the destination is unreachable.
Common IP SLA Issues
![]() IP SLAs require readiness on the sender side, the responder side, and the network. Issues related to performance are common because probes will cause a burden if overscheduled, if multiple senders overwhelm one receiver, or if the device is already a bottleneck and its CPU utilization is high. Senders generally suffer more from the overscheduling and frequency of probes. Probe scheduling can be problematic if the clock on the device is out of sync; that is the reason synchronizing through Network Time Protocol (NTP) is highly recommended. For example, if you schedule for December 31 at 23:59, but the sender clock is set to last year, the probe will not go out when you expect it to. Network readiness is also essential; when using IP SLAs for troubleshooting purposes, the very same reason that prevents a certain application from working on the network will prevent the probe from working. Typically, it is the firewalls and access control mechanisms that filter or block traffic.
IP SLAs require readiness on the sender side, the responder side, and the network. Issues related to performance are common because probes will cause a burden if overscheduled, if multiple senders overwhelm one receiver, or if the device is already a bottleneck and its CPU utilization is high. Senders generally suffer more from the overscheduling and frequency of probes. Probe scheduling can be problematic if the clock on the device is out of sync; that is the reason synchronizing through Network Time Protocol (NTP) is highly recommended. For example, if you schedule for December 31 at 23:59, but the sender clock is set to last year, the probe will not go out when you expect it to. Network readiness is also essential; when using IP SLAs for troubleshooting purposes, the very same reason that prevents a certain application from working on the network will prevent the probe from working. Typically, it is the firewalls and access control mechanisms that filter or block traffic.
Common NBAR Issues
![]() NBAR is a traffic-classification mechanism that allows you to classify based on application-layer components. What can be done with the resulting traffic classes varies. You can apply a QoS mechanism to a traffic class or block traffic that matches a traffic class, assuming it is conducting a malicious attack. NBAR does not detect traffic that uses nonstandard ports. A typical example would be running HTTP on port 8080 or other nonstandard ports for security reasons. At any time you can check the current NBAR port map using the command show ip nbar port-map. NBAR allows you to map any port you wish and even map multiple ports simultaneously to a single application or protocol, using the following command:
NBAR is a traffic-classification mechanism that allows you to classify based on application-layer components. What can be done with the resulting traffic classes varies. You can apply a QoS mechanism to a traffic class or block traffic that matches a traffic class, assuming it is conducting a malicious attack. NBAR does not detect traffic that uses nonstandard ports. A typical example would be running HTTP on port 8080 or other nonstandard ports for security reasons. At any time you can check the current NBAR port map using the command show ip nbar port-map. NBAR allows you to map any port you wish and even map multiple ports simultaneously to a single application or protocol, using the following command:
ip nbar port-map protocol-name [tcp | udp] port-number
![]() Yet another issue that affects most NBAR deployments is application support. Traffic going unnoticed by NBAR and not being classified will have important implications, especially if you were using NBAR for critical functions such as security. The solution to this problem is to load a PDLM. PDLMs, which are readily available at Cisco.com for users with proper permissions, will upgrade the application definition for NBAR in your router. This is similar to upgrading antivirus software with a new virus definition file.
Yet another issue that affects most NBAR deployments is application support. Traffic going unnoticed by NBAR and not being classified will have important implications, especially if you were using NBAR for critical functions such as security. The solution to this problem is to load a PDLM. PDLMs, which are readily available at Cisco.com for users with proper permissions, will upgrade the application definition for NBAR in your router. This is similar to upgrading antivirus software with a new virus definition file.
Common AutoQoS Issues
![]() Many of the common Cisco AutoQoS issues relate directly to its requirements and limitations, such as not having CEF enabled. Cisco AutoQoS requires CEF to be enabled on the interface, and the interface must be configured with an IP address and a specific (proper) bandwidth. Note that the bandwidth on a serial interface is not autosensed. Cisco AutoQoS uses the configured interface bandwidth to enable or disable certain QoS features such as compression and fragmentation. Another common AutoQoS problem cause is mismatched parameters on the two sides of a serial link. If the configured bandwidths differ, for example, Cisco AutoQoS might enable certain features on one side while disabling them on the other side of the same link. This can cause Layer 2 issues and bring the interface down. Modifying the Cisco AutoQoS configuration after the feature has been enabled can prove problematic, too. For example, if you disable AutoQoS on an interface using the no auto qos command, all Cisco AutoQoS generated commands are removed with the exception of those that have been changed/modified. If you do not remove those commands manually, they might cause errors or performance problems. Finally, you must know that AutoQoS does not work on an interface if it already has a policy applied to it. Before you apply AutoQoS, confirm that the interface has an IP address, has proper bandwidth configured, has CEF enabled, and has no policies applied to it already.
Many of the common Cisco AutoQoS issues relate directly to its requirements and limitations, such as not having CEF enabled. Cisco AutoQoS requires CEF to be enabled on the interface, and the interface must be configured with an IP address and a specific (proper) bandwidth. Note that the bandwidth on a serial interface is not autosensed. Cisco AutoQoS uses the configured interface bandwidth to enable or disable certain QoS features such as compression and fragmentation. Another common AutoQoS problem cause is mismatched parameters on the two sides of a serial link. If the configured bandwidths differ, for example, Cisco AutoQoS might enable certain features on one side while disabling them on the other side of the same link. This can cause Layer 2 issues and bring the interface down. Modifying the Cisco AutoQoS configuration after the feature has been enabled can prove problematic, too. For example, if you disable AutoQoS on an interface using the no auto qos command, all Cisco AutoQoS generated commands are removed with the exception of those that have been changed/modified. If you do not remove those commands manually, they might cause errors or performance problems. Finally, you must know that AutoQoS does not work on an interface if it already has a policy applied to it. Before you apply AutoQoS, confirm that the interface has an IP address, has proper bandwidth configured, has CEF enabled, and has no policies applied to it already.
Troubleshooting Example: Network Application Services Problem
![]() This section presents three troubleshooting examples related to NetFlow, IP SLA, and AutoQoS. Table 7-1 presents some the useful troubleshooting commands related to these technologies. Most of these commands are referenced during the troubleshooting examples.
This section presents three troubleshooting examples related to NetFlow, IP SLA, and AutoQoS. Table 7-1 presents some the useful troubleshooting commands related to these technologies. Most of these commands are referenced during the troubleshooting examples.
|
|
|
|---|---|
|
|
|
|
|
|
|
|
|
|
|
|
NetFlow Troubleshooting Example
![]() The first troubleshooting example is based on Figure 7-7. NetFlow is used for traffic metering and baselining, and a NetFlow Collector server with the IP address 10.1.1.10 is used to collect and aggregate NetFlow data. The reported problem is that the NetFlow Collector is not receiving data from router R1, one of the NetFlow-enabled routers. Start this troubleshooting exercise by testing connectivity between R1 and the NetFlow Collector and checking the NetFlow-specific configuration (to verify the configured parameters). Using the ping command, you can confirm IP connectivity between R1 and NetFlow Collector, and through some fact gathering, you can discover that the NetFlow Collector’s address is 10.1.1.10, the NetFlow port number is 9991, and the server is configured to receive NetFlow data only from devices on subnet 10.254.0.0/24. Furthermore, the show ip flow interface command verifies that on router R1, NetFlow is active on interface serial 0/0 for ingress traffic.
The first troubleshooting example is based on Figure 7-7. NetFlow is used for traffic metering and baselining, and a NetFlow Collector server with the IP address 10.1.1.10 is used to collect and aggregate NetFlow data. The reported problem is that the NetFlow Collector is not receiving data from router R1, one of the NetFlow-enabled routers. Start this troubleshooting exercise by testing connectivity between R1 and the NetFlow Collector and checking the NetFlow-specific configuration (to verify the configured parameters). Using the ping command, you can confirm IP connectivity between R1 and NetFlow Collector, and through some fact gathering, you can discover that the NetFlow Collector’s address is 10.1.1.10, the NetFlow port number is 9991, and the server is configured to receive NetFlow data only from devices on subnet 10.254.0.0/24. Furthermore, the show ip flow interface command verifies that on router R1, NetFlow is active on interface serial 0/0 for ingress traffic.


![]() To check whether R1 is actually exporting NetFlow and if there are any flows to export, you use the show ip cache flow command on R1. As you can see in the output shown in Example 7-5, R1 is collecting plenty of data. Next, you check if R1 is exporting the NetFlow data to the correct server using the show ip flow export command. Based on the output (also shown on Example 7-5), there are a fair number of exported flows, but the IP address of the NetFlow Collector and the source interface are incorrect. The NetFlow Collector’s address is 10.1.152.1 instead of 10.1.1.10, and the source interface is FastEthernet0/0 rather than Loopback0.
To check whether R1 is actually exporting NetFlow and if there are any flows to export, you use the show ip cache flow command on R1. As you can see in the output shown in Example 7-5, R1 is collecting plenty of data. Next, you check if R1 is exporting the NetFlow data to the correct server using the show ip flow export command. Based on the output (also shown on Example 7-5), there are a fair number of exported flows, but the IP address of the NetFlow Collector and the source interface are incorrect. The NetFlow Collector’s address is 10.1.152.1 instead of 10.1.1.10, and the source interface is FastEthernet0/0 rather than Loopback0.
IP packet size distribution
1-32 64 96 128 160 192 224 256 288 320 352 384 416 448 480
.000 .687 .000 .312 .000 .000 .000 .000 .000 .000 .000 .000 .000 .000 .000
512 544 576 1024 1536 2048 2560 3072 3584 4096 4608
.000 .000 .000 .000 .000 .000 .000 .000 .000 .000 .000
IP Flow Switching Cache, 278544 bytes
0 active, 4096 inactive, 12 added
192 ager polls, 0 flow alloc failures
Active flows timeout in 30 minutes
Inactive flows timeout in 15 seconds
IP Sub Flow Cache, 21640 bytes
0 active, 1024 inactive, 12 added, 12 added to flow
0 alloc failures, 0 force free
1 chunk, 1 chunk added
last clearing of statistics never
Protocol Total Flows Packets Bytes Packets Active (Sec) Idle (Sec)
———— Flows /Sec /Flow /Pkt /Sec /Flow /Flow
UDP-other 11 0.0 1 52 0.0 0.0 15.6
ICMP 1 0.0 5 100 0.0 0.1 15.6
Total 12 0.0 1 67 0.0 0.0 15.6
SrcIF SrcIPaddress DstIf DstIPaddress Pr SrcP DstP Pkts
Se0/0 172.16.1.2 Local 172.16.1.1 01 0000 0301 1
Se0/0 172.16.1.2 Null 255.255.255.255 11 0208 0208 1
R1#
R1# show ip flow export
Flow export v5 is enabled for main cache
Exporting flows to 10.1.152.1 (9991)
Exporting using source interface FastEthernet0/0
Version 5 flow records
5 flows exported in 3 udp datagrams
0 flows failed due to lack of export packet
0 export packets were sent up to process level
0 export packets were dropped due to no fib
0 export packets were dropped due to adjacency issues
0 export packets were dropped due to fragmentation failures
0 export packets were dropped due to encapsulation fixup failures
R1#
![]() You correct the two mistakes you have found, namely the NetFlow Collector’s address and IP NetFlow’s source interface. Next, verify your work using the show ip flow export command once again, as shown in Example 7-6.
You correct the two mistakes you have found, namely the NetFlow Collector’s address and IP NetFlow’s source interface. Next, verify your work using the show ip flow export command once again, as shown in Example 7-6.
Enter configuration commands, one per line. End with CNTL/Z.
R1(config)# no ip flow-ex destination 10.1.152.1 9991
R1(config)#
R1(config)#
R1(config)# ip flow-ex destination 10.1.1.10 9991
R1(config)#
R1(config)# end
R1#
R1#
R1# conf t
Enter configuration commands, one per line. End with CNTL/Z.
R1(config)# no ip flow-export source f0/0
R1(config)# ip flow-export source lo0
R1(config)#
R1(config)# end
R1#
R1#
R1# show ip flow export
Flow export v5 is enabled for main cache
Exporting flows to 10.1.1.10 (9991)
Exporting using source interface Loopback0
version 5 flow records
29 flows exported in 22 udp datagrams
0 flows failed due to lack of export packet
5 export packets were sent up to process level
0 export packets were dropped due to no fib
0 export packets were dropped due to adjacency issues
0 export packets were dropped due to fragmentation failures
0 export packets were dropped due to encapsulation fixup failures
R1#
![]() NetFlow Collector is now receiving the NetFlow exports; the problem is solved.
NetFlow Collector is now receiving the NetFlow exports; the problem is solved.
IP SLA Troubleshooting Example
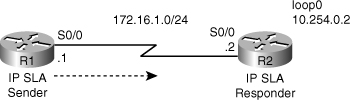
![]() The IP SLA troubleshooting example is based on the diagram shown in Figure 7-8. In this case, to measure delay, a TCP connection probe (entry 1) is sent on port 2002 from R1 to R2 every 10 minutes, and SNMP traps are sent to an SNMP console if a certain threshold is surpassed. The problem is that the probe does not start and it does not report any statistics. To start this troubleshooting exercise, first check to see whether the SLA sender is sending and if the SLA receiver is receiving.
The IP SLA troubleshooting example is based on the diagram shown in Figure 7-8. In this case, to measure delay, a TCP connection probe (entry 1) is sent on port 2002 from R1 to R2 every 10 minutes, and SNMP traps are sent to an SNMP console if a certain threshold is surpassed. The problem is that the probe does not start and it does not report any statistics. To start this troubleshooting exercise, first check to see whether the SLA sender is sending and if the SLA receiver is receiving.
![]() The first thing to do is use the show ip sla monitor configuration command on R1, the SLA sender. The output, as shown in Example 7-7, displays correct information about probe number 1.
The first thing to do is use the show ip sla monitor configuration command on R1, the SLA sender. The output, as shown in Example 7-7, displays correct information about probe number 1.
SA Agent, Infrastructure Engine-II
Entry number: 1
Owner:
Tag:
Type of operation to perform: tcpConnect
Target address: 10.254.0.2
Source address: 0.0.0.0
Target port: 2002
Source port: 0
Operation timeout (milliseconds): 60000
Type of service parameters: 0x0
Control packets: enabled
Operation frequency (seconds): 600
Next Scheduled Start Time: 23:59:00
Group Scheduled: FALSE
Life (seconds): Forever
Entry Ageout (seconds): never
Recurring (Starting Everyday): FALSE
Status of entry (SNMP RowStatus): Active
Threshold (milliseconds): 5000
Number of statistic hours kept: 2
Number of statistic distribution buckets kept: 1
Statistic distribution interval (milliseconds): 20
--More--
![]() Next, use the show ip sla monitor statistics, and notice in the output (see Example 7-8) that no results are reported for probe 1 whatsoever (they are all unknown).
Next, use the show ip sla monitor statistics, and notice in the output (see Example 7-8) that no results are reported for probe 1 whatsoever (they are all unknown).
Round trip time (RTT) Index 1
Latest RTT: Unknown
Latest operation return code: Unknown
Latest operation start time: Unknown
Number of successes: 0
Number of failures: 0
Operation time to live: Forever
![]() Next, look at the SLA configuration on R1 (shown in Example 7-9), using the show run | section ip sla command. Notice that the probe was supposed to start at 23:59, and even though it is past that time, it has not started. Ensure that R1’s clock is synchronized with the NTP server.
Next, look at the SLA configuration on R1 (shown in Example 7-9), using the show run | section ip sla command. Notice that the probe was supposed to start at 23:59, and even though it is past that time, it has not started. Ensure that R1’s clock is synchronized with the NTP server.
ip sla monitor 1
type tcpConnect dest-ipaddr 10.254.0.2 dest-port 2002
frequency 600
ip sla monitor schedule 1 life forever start-time 23:59:00 Sep 10
ip sla monitor 2
type echo protocol ipIcmpEcho 10.9.9.21 source-interface FastEhternet0/0
ip sla monitor schedule 2 life forever start-time now
ip sla monitor 3
type udpEcho dest-ipaddr 10.1.1.100 dest-port 5247
ip sla monitor schedule 3 life forever start-time now
R1#
![]() When you check the NTP status on R1, you notice that it is not synchronized with the NTP server (see Example 7-10). The phrase no reference clock in the output indicates that the NTP server, which is R2’s address 10.254.0.2, is unavailable. On R2, enter the ntp master 1 command and check R1’s NTP status again (also shown in Example 7-10). Now the clock on R1 is synchronized with the NTP master (10.254.0.2).
When you check the NTP status on R1, you notice that it is not synchronized with the NTP server (see Example 7-10). The phrase no reference clock in the output indicates that the NTP server, which is R2’s address 10.254.0.2, is unavailable. On R2, enter the ntp master 1 command and check R1’s NTP status again (also shown in Example 7-10). Now the clock on R1 is synchronized with the NTP master (10.254.0.2).
Clock is unsynchronized, stratum 16, no reference clock
nominal freq is 250.0000 Hz, actual freq is 250.0000 Hz, precision is 2**18
reference time is CE3D3F49.C3932713 (16:33:13.763 UTC Mon Aug 24 2009)
clock offset is 1.2491 msec, root delay is 22.99 msec
root dispersion is 1.68 msec, peer dispersion is 0.41 msec
R1#
R2# conf t
Enter configuration commands, one per line. End with CNTL/Z.
R2(config)# ntp master 1
R2(config)#
R2(config)# end
R2#
R1# show ntp status
Clock is synchronized, stratum 2, reference is 10.254.0.2
nominal freq is 250.0000 Hz, actual freq is 250.0000 Hz, precision is 2**18
reference time is CE54DCFD.19C87A09 (14:28:13.100 UTC Fri Sep 11 2009)
clock offset is 0.4728 msec, root delay is 22.87 msec
root dispersion is 7875.56 msec, peer dispersion is 7875.08 msec
R1#
![]() At this point, you can return to the original problem, namely IP SLA, and see whether the monitor (probe) on R1 has successfully started. On R1, use the show ip sla monitor statistics; the results (shown in Example 7-11) look great: SLA monitor 1 has started with the return code of Ok and there has been one success and no failures. The IP SLA problem has been solved.
At this point, you can return to the original problem, namely IP SLA, and see whether the monitor (probe) on R1 has successfully started. On R1, use the show ip sla monitor statistics; the results (shown in Example 7-11) look great: SLA monitor 1 has started with the return code of Ok and there has been one success and no failures. The IP SLA problem has been solved.
Round trip time (RTT) Index 1
Latest RTT: 20 ms
Latest operation start time: 14:31:17.083 UTC Fri Sep 11 2009
Latest operation return code: Ok
Number of successes: 1
Number of failures: 0
Operation time to live: Forever
Round trip time (RTT) Index 2
Latest RTT: NoConnection/Busy/Timeout
Latest operation start time: 14:31:41.239 UTC Fri Sep 11 2009
Latest operation return code: No connection
Number of successes: 0
Number of failures: 24
Operation time to live: Forever
Round trip time (RTT) Index 3
Latest RTT: NoConnection/Busy/Timeout
Latest operation start time: 14:31:47.659 UTC Fri Sep 11 2009
Latest operation return code: No connection
Number of successes: 0
Number of failures: 24
AutoQoS Troubleshooting Example
![]() The third troubleshooting example is based on the diagram in Figure 7-9. The connection between routers R1 and R2 is down; however, the service provider maintains that the backbone service is fully operational.
The third troubleshooting example is based on the diagram in Figure 7-9. The connection between routers R1 and R2 is down; however, the service provider maintains that the backbone service is fully operational.
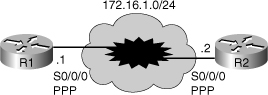
![]() First, you want to check the status of the IP interfaces on R1, using the show ip interfaces brief command, and see that serial 0/0/0 is up, but the line protocol is down (see the output shown in Example 7-12). Using the show interfaces command, you will notice that serial 0/0/0 is configured for High-Level Data Link Control (HDLC) encapsulation. The documentation, however, indicates that this serial interface must be configured for PPP encapsulation.
First, you want to check the status of the IP interfaces on R1, using the show ip interfaces brief command, and see that serial 0/0/0 is up, but the line protocol is down (see the output shown in Example 7-12). Using the show interfaces command, you will notice that serial 0/0/0 is configured for High-Level Data Link Control (HDLC) encapsulation. The documentation, however, indicates that this serial interface must be configured for PPP encapsulation.
Interface IP-Address OK? Method Status Protocol
FastEthernet0/0 unassigned YES unset up up
FastEthernet0/1 unassigned YES unset administratively down down
Serial0/0/0 172.16.1.1 YES unset up down
R1#
![]() On R1, you fix the encapsulation problem by going into interface configuration mode for the interface s0/0/0 and changing the encapsulation to PPP. As you can see in the output shown in Example 7-13, the interface serial 0/0/0’s line protocol status changes to up, and a ping from R1 to R2 (to ensure end-to-end connectivity) is successful.
On R1, you fix the encapsulation problem by going into interface configuration mode for the interface s0/0/0 and changing the encapsulation to PPP. As you can see in the output shown in Example 7-13, the interface serial 0/0/0’s line protocol status changes to up, and a ping from R1 to R2 (to ensure end-to-end connectivity) is successful.
Enter configuration commands, one per line. End with CNTL/Z.
R1(config)# int s0/0/0
R1(config-if)# encap ppp
R1(config-if)# shut
R1(config-if)# no shut
Sep 11 14:44:28.164: %LINK-%-CHANGED: Interface Serial0/0/0, changed state to
administratively down
R1(config-if)# end
R1#
Sep 11 14:44:30.984: %SYS-5-CONFIG_I: Configured from console by console
Sep 11 14:44:32.356: %LINK-3-UPDOWN: Interface Serial0/0/0, changed state to up
Sep 11 14:44:33.364: %LINEPROTO-5-UPDOWN: Line protocol on Interface Serial0/0/0,
changed state to up
R1#
R1# ping 172.16.1.2
Type escape sequence to abort.
Sending 5, 100-byte ICMP Echos to 172.16.1.2, timeout is 2 seconds:
!!!!!
Success rate is 100 percent (5/5), round-trip min/avg/max = 28/28/28 ms
R1#
![]() It seems strange that the encapsulation on serial 0/0/0 was changed from PPP to HDLC. Through some investigation and fact gathering, you learn that the problem was reported after someone tried to enable AutoQoS on this interface. Apparently, after encountering errors, that person removed AutoQoS, but the circuit remained down. What that person did not know is that when AutoQoS was removed, the interface encapsulation was changed back to serial interface default encapsulation, which is HDLC. All that was needed was to set the encapsulation to PPP, as done in Example 7-13; however, the issue that remains is that you need to make use of AutoQoS on this interface. AutoQoS (enterprise) has two phases. In the first phase, you need to enable “autodiscovery” on the interface for a while (minimum of 3 days is recommended). In the second phase, you actually enable AutoQoS, which will generate templates and policies based on the discovery enabled in phase one. Example 7-14 shows this work, but notice that the interface went down soon after we entered the auto qos command on serial 0/0/0. It seems that AutoQoS attempted to set the multilink feature on serial 0/0/0 and that failed.
It seems strange that the encapsulation on serial 0/0/0 was changed from PPP to HDLC. Through some investigation and fact gathering, you learn that the problem was reported after someone tried to enable AutoQoS on this interface. Apparently, after encountering errors, that person removed AutoQoS, but the circuit remained down. What that person did not know is that when AutoQoS was removed, the interface encapsulation was changed back to serial interface default encapsulation, which is HDLC. All that was needed was to set the encapsulation to PPP, as done in Example 7-13; however, the issue that remains is that you need to make use of AutoQoS on this interface. AutoQoS (enterprise) has two phases. In the first phase, you need to enable “autodiscovery” on the interface for a while (minimum of 3 days is recommended). In the second phase, you actually enable AutoQoS, which will generate templates and policies based on the discovery enabled in phase one. Example 7-14 shows this work, but notice that the interface went down soon after we entered the auto qos command on serial 0/0/0. It seems that AutoQoS attempted to set the multilink feature on serial 0/0/0 and that failed.
Enter configuration commands, one per line. End with CNTL/Z
R1(config)# int s0/0/0
R1(config-if)# auto discovery qos
! Recommended practice dictates letting auto discovery run for some time,
preferably 3-5 days
R1(config-if)# auto qos
R1(config-if)#
Sep 11 14:52:54.141: %LINK-3-UPDOWN: Interface Multilink2001100115, changed
state to down
Sep 11 14:52:55.273: %RMON-5-FALLINGTRAP: Falling trap is generated because
the value of cbQosCMDropBitRate.1317.1319 has fallen below the
falling-threshold value 0
![]() AutoQoS attempts the multilink feature for fragmentation purposes, on low bandwidth interfaces. You need to find out what is the configured bandwidth for the serial 0/0/0 interface. R1’s running configuration reveals that the bandwidth on serial 0/0/0 is set to 200 (kbps) rather than 2000 (see Example 7-15). This tells you why AutoQoS considered this interface a slow bandwidth interface and attempted the multilink feature on it.
AutoQoS attempts the multilink feature for fragmentation purposes, on low bandwidth interfaces. You need to find out what is the configured bandwidth for the serial 0/0/0 interface. R1’s running configuration reveals that the bandwidth on serial 0/0/0 is set to 200 (kbps) rather than 2000 (see Example 7-15). This tells you why AutoQoS considered this interface a slow bandwidth interface and attempted the multilink feature on it.
Building configuration...
Current configuration : 277 bytes
!
interface Serial0/0/0
bandwidth 200
ip address 172.16.1.1 255.255.255.0
ip nbar protocol-discovery
ip flow ingress
encapsulation ppp
auto qos
auto discovery qos
no fair-queue
ppp multilink
ppp multilink group 2001100115
service-policy input TEST
service-policy output TEST
end
R1#
R1#
![]() The next logical step is to fix the bandwidth configuration on R1’s serial 0/0/0 interface and reapply the AutoQoS feature; however, you need to remove AutoQoS first. When you remove the AutoQoS feature, an error occurs and a message indicates that all policies have not been removed. Therefore, when you retry the AutoQoS feature, you receive yet another error message that indicates because there is a policy on the interface, AutoQoS cannot be applied. This is shown in Example 7-16.
The next logical step is to fix the bandwidth configuration on R1’s serial 0/0/0 interface and reapply the AutoQoS feature; however, you need to remove AutoQoS first. When you remove the AutoQoS feature, an error occurs and a message indicates that all policies have not been removed. Therefore, when you retry the AutoQoS feature, you receive yet another error message that indicates because there is a policy on the interface, AutoQoS cannot be applied. This is shown in Example 7-16.
Enter configuration commands, one per line. End with CNTL/Z
R1(config)# int s0/0/0
R1(config-if)# no auto qos
% Cannot disable multilink on a multilink group interface
% Not all config may be removed and may reappear after reactivating the
Logical-interface/sub-interfaces
R1(config-if)# bandwidth 2000
R1(config-if)# auto qos
Policy map TEST is already attached
AutoQoS Error: the following command was not properly applied:
service-policy output AutoQoS-Policy-UnTrust
R1(config-if)# end
R1#
R1#
R1#
Sep 11 14:56:49.329: %LINK-3-CHANGED: Interface Multilink2001100115, changed
state to administratively down
Sep 11 14:56:50.205: %SYS-5-CONFIG_I: Configured from console by console
![]() The running configuration shown in Example 7-15 shows a service policy called TEST is applied to serial 0/0/0 interface for both inbound and outbound traffic. You must remove those lines, reset encapsulation back to PPP, and then reapply AutoQoS. This time AutoQoS succeeds, and the interface stays up. Test the connection between R1 and R2 with a ping to ensure success (see the output shown in Example 7-17). It is important to keep in mind that you can only remove policies after verifying they are not necessary. In this case, as the name implies, the TEST policy was put in place for testing purposes but it was not removed upon test completion.
The running configuration shown in Example 7-15 shows a service policy called TEST is applied to serial 0/0/0 interface for both inbound and outbound traffic. You must remove those lines, reset encapsulation back to PPP, and then reapply AutoQoS. This time AutoQoS succeeds, and the interface stays up. Test the connection between R1 and R2 with a ping to ensure success (see the output shown in Example 7-17). It is important to keep in mind that you can only remove policies after verifying they are not necessary. In this case, as the name implies, the TEST policy was put in place for testing purposes but it was not removed upon test completion.
Type escape sequence to abort.
Sending 5, 100-byte ICMP Echos to 172.16.1.2, timeout is 2 seconds:
!!!!!
Success rate is 100 percent (5/5), round-trip min/avg/max = 28/28/32 ms
R1#
0 comments
Post a Comment