
Implementing Network Monitoring
![]() When designing a campus network, when redundancy is created, managing redundancy can be achieved by monitoring the network, through SNMP and Syslog (System Logging), and testing connectivity with an IP SLA. This section describes these various elements and explains how to implement them.
When designing a campus network, when redundancy is created, managing redundancy can be achieved by monitoring the network, through SNMP and Syslog (System Logging), and testing connectivity with an IP SLA. This section describes these various elements and explains how to implement them.
 Network Management Overview
![]() Network management is a set of tools and processes to help manage the network, as shown in Figure 5-17. Network administrators use network management so they can be confident in the performance of the network. The following are some of the capabilities of well-configured network management:
Network management is a set of tools and processes to help manage the network, as shown in Figure 5-17. Network administrators use network management so they can be confident in the performance of the network. The following are some of the capabilities of well-configured network management:
- Ability to verify the network is working well and behaving in the planned manner
- Ability to understand how much traffic is flowing and where it is flowing in the network
- Ability to troubleshoot the network


![]() The following tools are used extensively for typical enterprise network management:
The following tools are used extensively for typical enterprise network management:
Syslog
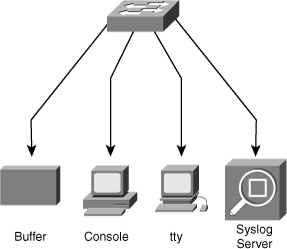
![]() The Cisco IOS system message logging (syslog) process enables a device to report and save important error and notification messages, either locally or to a remote logging server. Syslog messages can be sent to local console connections, the system buffer, or remote syslog servers, as shown in Figure 5-18. Syslog enables text messages to be sent to a syslog server using UDP port 514.
The Cisco IOS system message logging (syslog) process enables a device to report and save important error and notification messages, either locally or to a remote logging server. Syslog messages can be sent to local console connections, the system buffer, or remote syslog servers, as shown in Figure 5-18. Syslog enables text messages to be sent to a syslog server using UDP port 514.
![]() Syslog provides a comprehensive reporting mechanism that logs system messages in plain English text. The syslog messages include both messages in a standardized format (called system logging messages, system error messages, or simply system messages) and output from debug commands. These messages are generated during network operation to assist with identifying the type and severity of a problem or to aid users in monitoring router activity such as configuration changes.
Syslog provides a comprehensive reporting mechanism that logs system messages in plain English text. The syslog messages include both messages in a standardized format (called system logging messages, system error messages, or simply system messages) and output from debug commands. These messages are generated during network operation to assist with identifying the type and severity of a problem or to aid users in monitoring router activity such as configuration changes.
![]() The system message and error reporting service (syslog) is an essential component of any network operating system. The system message service reports system state information to a network manager.
The system message and error reporting service (syslog) is an essential component of any network operating system. The system message service reports system state information to a network manager.
![]() Cisco devices produce syslog messages as a result of network events. Every syslog message contains a severity level and a facility. Many networking devices support syslog, including routers, switches, application servers, firewalls, and other network appliances.
Cisco devices produce syslog messages as a result of network events. Every syslog message contains a severity level and a facility. Many networking devices support syslog, including routers, switches, application servers, firewalls, and other network appliances.
![]() The smaller numerical levels are the more critical syslog alarms. The complete list of syslog levels are shown in Table 5-1.
The smaller numerical levels are the more critical syslog alarms. The complete list of syslog levels are shown in Table 5-1.
|
|
|
|---|---|
|
|
|
|
|
|
|
|
|
|
|
|
|
|
|
|
|
|
|
|
|
|
|
|
![]() Syslog facilities are service identifiers that identify and categorize system state data for error and event message reporting. Cisco IOS Software has more than 500 facilities. The most common syslog facilities are
Syslog facilities are service identifiers that identify and categorize system state data for error and event message reporting. Cisco IOS Software has more than 500 facilities. The most common syslog facilities are
- IP
- OSPF protocol
- SYS operating system
- IP Security (IPsec)
- Route Switch Processor (RSP)
![]() Other facilities include Cisco Discovery Protocol, STP, multicast, IPsec, TCP, BGP, RADIUS, Telnet, and those facilities related to QoS services.
Other facilities include Cisco Discovery Protocol, STP, multicast, IPsec, TCP, BGP, RADIUS, Telnet, and those facilities related to QoS services.
![]() More syslog information is located at www.cisco.com/univercd/cc/td/doc/product/software/ios123/123sup/123sems/index.htm.
More syslog information is located at www.cisco.com/univercd/cc/td/doc/product/software/ios123/123sup/123sems/index.htm.
Syslog Message format
![]() The system messages begin with a percent sign (%) and are structured as shown in Figure 5-19.
The system messages begin with a percent sign (%) and are structured as shown in Figure 5-19.


- Facility: A code consisting of two or more uppercase letters that indicates the hardware device, protocol, or a module of the system software.
- Severity: A single-digit code from 0 to 7 that reflects the severity of the condition. The lower the number, the more serious the situation.
- Mnemonic: A code that uniquely identifies the error message.
- Message-text: A text string describing the condition. This portion of the message sometimes contains detailed information about the event, including terminal port numbers, network addresses, or addresses that correspond to locations in the system memory address space.
![]() Figure 5-19 shows a typical message that indicates the operating system (facility = SYS) is providing a notification (SEVERITY = 5) has been configured (MNEUMONIC = CONFIG). The message text indicates that a user on VTY0 from IP address 192.168.64.25 made this change.
Figure 5-19 shows a typical message that indicates the operating system (facility = SYS) is providing a notification (SEVERITY = 5) has been configured (MNEUMONIC = CONFIG). The message text indicates that a user on VTY0 from IP address 192.168.64.25 made this change.
| Note |
|
![]() Example 5-1 shows samples of syslog messages that Cisco IOS Software produces. The most common messages are link up and down messages and messages that a device produces when it exits from configuration mode. If ACL logging is configured, the device generates syslog messages when packets match a parameter condition. ACL logging can be useful for detecting packets that are denied access based on the security policy set by an ACL.
Example 5-1 shows samples of syslog messages that Cisco IOS Software produces. The most common messages are link up and down messages and messages that a device produces when it exits from configuration mode. If ACL logging is configured, the device generates syslog messages when packets match a parameter condition. ACL logging can be useful for detecting packets that are denied access based on the security policy set by an ACL.
state to up
08:01:23: %DUAL-5-NBRCHANGE: EIGRP-IPv4:(1) 1: Neighbor 10.1.1.1 (Vlan1) is up:
new adjacency
08:02:31: %LINK-3-UPDOWN: Interface FastEthernet0/8, changed state to up
08:18:20: %LINEPROTO-5-UPDOWN: Line protocol on Interface FastEthernet0/5, changed
state to down
08:18:22: %LINEPROTO-5-UPDOWN: Line protocol on Interface FastEthernet0/5, changed
state to up
08:18:24: %LINEPROTO-5-UPDOWN: Line protocol on Interface FastEthernet0/2, changed
state to down
08:18:24: %ILPOWER-5-IEEE_DISCONNECT: Interface Fa0/2: PD removed
08:18:26: %LINK-3-UPDOWN: Interface FastEthernet0/2, changed state to down
08:19:49: %ILPOWER-7-DETECT: Interface Fa0/2: Power Device detected: Cisco PD
08:19:53: %LINK-3-UPDOWN: Interface FastEthernet0/2, changed state to up
08:19:53: %LINEPROTO-5-UPDOWN: Line protocol on Interface FastEthernet0/2, changed
state to up
![]() System log messages can contain up to 80 characters and a percent sign (%), which follows the optional sequence number or timestamp information, if configured. Messages are displayed in this format:
System log messages can contain up to 80 characters and a percent sign (%), which follows the optional sequence number or timestamp information, if configured. Messages are displayed in this format:
![]() A sequence number appears on the syslog message if the service sequence-numbers global configuration command is configured.
A sequence number appears on the syslog message if the service sequence-numbers global configuration command is configured.
![]() The timestamp shows the date and time of the message or event if the service timestamps [debug | log] [datetime uptime] [localtime |msec|show-timezone|year] global configuration command is configured. The timestamp can be have one of three formats:
The timestamp shows the date and time of the message or event if the service timestamps [debug | log] [datetime uptime] [localtime |msec|show-timezone|year] global configuration command is configured. The timestamp can be have one of three formats:
- mm/dd hh:mm:ss
- hh:mm:ss (short uptime)
- d h (long uptime)
Configuring Syslog
![]() To configure a syslog server, use the command logging <ip address of the Syslog server>.
To configure a syslog server, use the command logging <ip address of the Syslog server>.
![]() To configure from which severity level messages have to be sent to the Syslog server, use the global configuration command logging trap level, as shown in Example 5-2.
To configure from which severity level messages have to be sent to the Syslog server, use the global configuration command logging trap level, as shown in Example 5-2.
<0-7> Logging severity level
alerts Immediate action needed (severity=1)
critical Critical conditions (severity=2)
debugging Debugging messages (severity=7)
emergencies System is unusable (severity=0)
errors Error conditions (severity=3)
informational Informational messages (severity=6)
notifications Normal but significant conditions (severity=5)
warnings Warning conditions (severity=4)
![]() Messages can be sent to a syslog server. They also can be kept on the local switch. To configure the local logs, use the command logging buffered, as shown in Example 5-3. Valid parameters are the maximum local log size and the severity level that has to be logged: Enabling higher logging with small buffer size might mean that your logging displays only a short duration of time before newer messages overwrite the older ones. Ensure the local log size is an appropriate size for your level of logging and time frame that you would like to see in the local logs.
Messages can be sent to a syslog server. They also can be kept on the local switch. To configure the local logs, use the command logging buffered, as shown in Example 5-3. Valid parameters are the maximum local log size and the severity level that has to be logged: Enabling higher logging with small buffer size might mean that your logging displays only a short duration of time before newer messages overwrite the older ones. Ensure the local log size is an appropriate size for your level of logging and time frame that you would like to see in the local logs.
<0-7> Logging severity level
<4096-2147483647> Logging buffer size
alerts Immediate action needed (severity=1)
critical Critical conditions (severity=2)
debugging Debugging messages (severity=7)
discriminator Establish MD-Buffer association
emergencies System is unusable (severity=0)
errors Error conditions (severity=3)
informational Informational messages (severity=6)
notifications Normal but significant conditions (severity=5)
warnings Warning conditions (severity=4)
xml Enable logging in XML to XML logging buffer
![]() Use the show logging command to display the content of the local log files. When too many events are present in the log files, use the pipe argument (|) in combination with keywords such as include or begin to filter the output. Example 5-4 shows how to display all events present in the local logs that involve an error report (severity level 3) about interface link status.
Use the show logging command to display the content of the local log files. When too many events are present in the log files, use the pipe argument (|) in combination with keywords such as include or begin to filter the output. Example 5-4 shows how to display all events present in the local logs that involve an error report (severity level 3) about interface link status.
2d20h: %LINK-3-UPDOWN: Interface FastEthernet0/1, changed state to up
2d20h: %LINK-3-UPDOWN: Interface FastEthernet0/2, changed state to up
2d20h: %LINK-3-UPDOWN: Interface FastEthernet0/1, changed state to up
![]() Example 5-5 shows another sample of how to display all events that start with %DUAL (therefore reporting events related to the EIGRP DUAL algorithm).
Example 5-5 shows another sample of how to display all events that start with %DUAL (therefore reporting events related to the EIGRP DUAL algorithm).
2d22h: %DUAL-5-NBRCHANGE: EIGRP-IPv4:(10) 10: Neighbor 10.1.253.13
(FastEthernet0/11) is down: interface down
2d22h: %LINK-3-UPDOWN: Interface FastEthernet0/11, changed state to down
2d22h: %LINEPROTO-5-UPDOWN: Line protocol on Interface FastEthernet0/11, changed
state to down
SNMP
![]() SNMP has become the standard for network management. SNMP is a simple solution that requires little code to implement and thus enables vendors to easily build SNMP agents for their products. Therefore, SNMP is often the foundation of network management architecture.
SNMP has become the standard for network management. SNMP is a simple solution that requires little code to implement and thus enables vendors to easily build SNMP agents for their products. Therefore, SNMP is often the foundation of network management architecture.
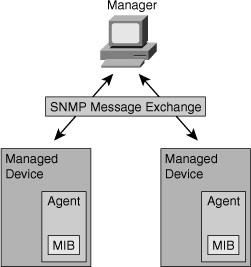
![]() SNMP contains three elements, as shown in Figure 5-20:
SNMP contains three elements, as shown in Figure 5-20:
- Network Management Application (SNMP Manager)
- SNMP Agents (running inside a managed device)
- MIB Database object that describes the information in a predetermined format that the agent can use to populate the data.
![]() SNMP defines how management information is exchanged between network management applications and management agents. A network management application periodically polls the SNMP agents that reside on managed devices by querying the device for data. The periodic SNMP polling has the disadvantage that there is delay between the time that an event occurs and the time that it is noticed by the NMS. There is a trade-off between polling frequency and bandwidth usage. A network management application can display the information in a GUI on the network manager. SNMP uses the User Datagram Protocol (UDP) transport mechanism of IP to retrieve and send management information, such as MIB variables.
SNMP defines how management information is exchanged between network management applications and management agents. A network management application periodically polls the SNMP agents that reside on managed devices by querying the device for data. The periodic SNMP polling has the disadvantage that there is delay between the time that an event occurs and the time that it is noticed by the NMS. There is a trade-off between polling frequency and bandwidth usage. A network management application can display the information in a GUI on the network manager. SNMP uses the User Datagram Protocol (UDP) transport mechanism of IP to retrieve and send management information, such as MIB variables.
![]() SNMP management agents that reside on managed devices collect and store information about the device and its operation, respond to managerial requests, and generate traps to inform the manager of certain events. SNMP traps are sent by management agents to the network management system when certain events occur. Trap-directed notification can result in substantial savings of network and agent resources by eliminating the need for some SNMP polling requests.
SNMP management agents that reside on managed devices collect and store information about the device and its operation, respond to managerial requests, and generate traps to inform the manager of certain events. SNMP traps are sent by management agents to the network management system when certain events occur. Trap-directed notification can result in substantial savings of network and agent resources by eliminating the need for some SNMP polling requests.
![]() The management agent collects data and stores it locally in the MIB. Community strings control access to the MIB. To view or set MIB variables, the user must specify the appropriate community string for read or write access.
The management agent collects data and stores it locally in the MIB. Community strings control access to the MIB. To view or set MIB variables, the user must specify the appropriate community string for read or write access.
SNMP Versions
![]() The initial version of the SNMP standard (SNMP version 1, or SNMPv1) is defined in RFC 1157. Following are five basic SNMP messages the network manager uses to transfer data from agents that reside on managed devices, as shown in Figure 5-21:
The initial version of the SNMP standard (SNMP version 1, or SNMPv1) is defined in RFC 1157. Following are five basic SNMP messages the network manager uses to transfer data from agents that reside on managed devices, as shown in Figure 5-21:
- Get Request: Used to request the value of a specific MIB variable from the agent.
- Get Next Request: Used after the initial Get Request to retrieve the next object instance from a table or a list.
- Set Request: Used to set a MIB variable on an agent.
- Get Response: Used by an agent to respond to a Get Request or Get Next Request from a manager.
- Trap: Used by an agent to transmit an unsolicited alarm to the manager. An agent sends a Trap message when a certain condition occurs, such as a change in the state of a device, a device or component failure, or an agent initialization or restart.


![]() SNMPv2 was introduced with RFC 1441, but members of the Internet Engineering Task Force (IETF) subcommittee could not agree on the security and administrative sections of the SNMPv2 specification. There were several attempts to achieve acceptance of SNMPv2 through the release of experimental modified versions.
SNMPv2 was introduced with RFC 1441, but members of the Internet Engineering Task Force (IETF) subcommittee could not agree on the security and administrative sections of the SNMPv2 specification. There were several attempts to achieve acceptance of SNMPv2 through the release of experimental modified versions.
![]() Community-based SNMPv2 (SNMPv2C), defined in RFC 1901, is the most common implementation. SNMPv2C deploys the administrative framework defined in SNMPv1, which uses read/write community strings for administrative access.
Community-based SNMPv2 (SNMPv2C), defined in RFC 1901, is the most common implementation. SNMPv2C deploys the administrative framework defined in SNMPv1, which uses read/write community strings for administrative access.
![]() SNMPv2 introduces two new message types:
SNMPv2 introduces two new message types:
- Get Bulk Request: Reduces repetitive requests and replies and improves performance when you are retrieving large amounts of data (for example, tables).
- Inform Request: Alert an SNMP manager of specific conditions. Unlike SNMP Trap messages, which are unconfirmed, the NMS acknowledges an Inform Request by sending an Inform Response message back to the requesting device.
![]() SNMPv2 adds new data types with 64-bit counters, because 32-bit counters were quickly outmoded by fast network interfaces. On Cisco routers, SNMPv2 is implemented in Cisco IOS Software Release 11.3 and later.
SNMPv2 adds new data types with 64-bit counters, because 32-bit counters were quickly outmoded by fast network interfaces. On Cisco routers, SNMPv2 is implemented in Cisco IOS Software Release 11.3 and later.
| Note |
|
![]() SNMPv3 is described in RFCs 3410 through 3415. It adds methods to ensure the secure transmission of critical data between managed devices.
SNMPv3 is described in RFCs 3410 through 3415. It adds methods to ensure the secure transmission of critical data between managed devices.
![]() SNMPv3 introduces three levels of security:
SNMPv3 introduces three levels of security:
- noAuthNoPriv: No authentication is required, and no privacy (encryption) is provided.
- authNoPriv: Authentication is based on Hash-based Message Authentication Code with Message Digest 5 (HMAC-MD5) or Hash-based Message Authentication Code with Secure Hash Algorithm (HMAC-SHA). No encryption is provided.
- authPriv: In addition to authentication, Cipher Block Chaining-Data Encryption Standard (CBC-DES) encryption is used as the privacy protocol.
![]() Security levels that are implemented for each security model determine which SNMP objects a user can access for reading, writing, or creating and the list of notifications that its users can receive.
Security levels that are implemented for each security model determine which SNMP objects a user can access for reading, writing, or creating and the list of notifications that its users can receive.
![]() On Cisco routers, SNMPv3 is implemented in Cisco IOS Software Release 12.0 and later.
On Cisco routers, SNMPv3 is implemented in Cisco IOS Software Release 12.0 and later.
SNMP Recommendations
![]() SNMPv1 and SNMPv2 use community strings in clear text. These community strings, as with all passwords, should be carefully chosen to ensure they are not trivial. Community strings should be changed at regular intervals and in accordance with network security policies. For example, the strings should be changed when a network administrator changes roles or leaves the company. If SNMP is used only to monitor devices, use read-only communities. Ensure that SNMP messages do not spread beyond the management consoles. You can use access-lists to prevent SNMP messages from going beyond the required devices, and on the monitored devices to limit access for management systems only.
SNMPv1 and SNMPv2 use community strings in clear text. These community strings, as with all passwords, should be carefully chosen to ensure they are not trivial. Community strings should be changed at regular intervals and in accordance with network security policies. For example, the strings should be changed when a network administrator changes roles or leaves the company. If SNMP is used only to monitor devices, use read-only communities. Ensure that SNMP messages do not spread beyond the management consoles. You can use access-lists to prevent SNMP messages from going beyond the required devices, and on the monitored devices to limit access for management systems only.
![]() SNMPv3 is recommended because it provides authentication and encryption.
SNMPv3 is recommended because it provides authentication and encryption.
Configuring SNMP
![]() To configure SNMP, follow these steps:
To configure SNMP, follow these steps:
|
|
|
|
|
|
|
|
|
|
|
|
![]() The first step needed for SNMP configuration is to enable SNMP access. This is done by configuring community strings, which act somewhat like passwords. The difference is that there can be several community strings, and that each one might grant different forms of access. In Example 5-6, community cisco grants read-only access to the local switch, while xyz123 grants read and write access to the local switch. The 100 at the end of the snmp-server community lines restricts access to sources permitted via standard access-list 100. In this case, all stations in subnet 10.1.1.0/24 can access the local switch with both communities cisco and xyz123.
The first step needed for SNMP configuration is to enable SNMP access. This is done by configuring community strings, which act somewhat like passwords. The difference is that there can be several community strings, and that each one might grant different forms of access. In Example 5-6, community cisco grants read-only access to the local switch, while xyz123 grants read and write access to the local switch. The 100 at the end of the snmp-server community lines restricts access to sources permitted via standard access-list 100. In this case, all stations in subnet 10.1.1.0/24 can access the local switch with both communities cisco and xyz123.
sw(config)# snmp-server community cisco RO 100
sw(config)# snmp-server community xyz123 RW 100
sw(config)# snmp-server trap 10.1.1.50
![]() It is critical to choose community strings that are stronger to ensure higher security. Choose strings that are at least eight charters in length and contain lower/upper CAPS mixed in with special characters and numerals.
It is critical to choose community strings that are stronger to ensure higher security. Choose strings that are at least eight charters in length and contain lower/upper CAPS mixed in with special characters and numerals.
![]() The snmp-server trap command has two purposes: It configures the SNMP server and instructs the switch to send its traps to this server.
The snmp-server trap command has two purposes: It configures the SNMP server and instructs the switch to send its traps to this server.
![]() There are many other SNMP options. Refer to this page for more information: www.cisco.com/en/US/docs/ios/netmgmt/configuration/guide/nm_cfg_snmp_sup_ps6350_TSD_Products_Configuration_Guide_Chapter.html.
There are many other SNMP options. Refer to this page for more information: www.cisco.com/en/US/docs/ios/netmgmt/configuration/guide/nm_cfg_snmp_sup_ps6350_TSD_Products_Configuration_Guide_Chapter.html.
IP Service Level Agreement
![]() The network has become increasingly critical for customers, and any downtime or degradation can adversely impact revenue. Companies need some form of predictability with IP services. An SLA is a contract between the network provider and its customers, or between a network department and internal corporate customers. It provides a form of guarantee to customers about the level of user experience.
The network has become increasingly critical for customers, and any downtime or degradation can adversely impact revenue. Companies need some form of predictability with IP services. An SLA is a contract between the network provider and its customers, or between a network department and internal corporate customers. It provides a form of guarantee to customers about the level of user experience.
![]() An SLA specifies connectivity and performance agreements for an end-user service from a service provider. The SLA typically outlines the minimum level of service and the expected level of service. The networking department can use the SLAs to verify that the service provider is meeting its own SLAs or to define service levels for critical business applications. An SLA can also be used as the basis for planning budgets and justifying network expenditures.
An SLA specifies connectivity and performance agreements for an end-user service from a service provider. The SLA typically outlines the minimum level of service and the expected level of service. The networking department can use the SLAs to verify that the service provider is meeting its own SLAs or to define service levels for critical business applications. An SLA can also be used as the basis for planning budgets and justifying network expenditures.
![]() Administrators can ultimately reduce the mean time to repair (MTTR) by proactively isolating network issues. They can change the network configuration based on optimized performance metrics.
Administrators can ultimately reduce the mean time to repair (MTTR) by proactively isolating network issues. They can change the network configuration based on optimized performance metrics.
![]() Typically, the technical components of an SLA contain a guarantee level for network availability, network performance in terms of round-trip time (RTT), and network response in terms of latency, jitter, and packet loss. The specifics of an SLA vary depending on the applications an organization is supporting in the network.
Typically, the technical components of an SLA contain a guarantee level for network availability, network performance in terms of round-trip time (RTT), and network response in terms of latency, jitter, and packet loss. The specifics of an SLA vary depending on the applications an organization is supporting in the network.
IP SLA Measurements
![]() The IP SLA measurement functionality in Cisco IOS Software enables configuration of a router to send synthetic traffic to a host computer or a router that has been configured to respond, as shown in Figure 5-22. One-way travel times and packet loss data are gathered. Certain measurements also enable jitter data to be collected.
The IP SLA measurement functionality in Cisco IOS Software enables configuration of a router to send synthetic traffic to a host computer or a router that has been configured to respond, as shown in Figure 5-22. One-way travel times and packet loss data are gathered. Certain measurements also enable jitter data to be collected.


![]() Following are several common functions for IP SLA measurements:
Following are several common functions for IP SLA measurements:
- Edge-to-edge network availability monitoring
- Network performance monitoring and network performance visibility
- VoIP, video, and virtual private network (VPN) monitoring
- IP service network health readiness or assessment
- Multiprotocol Label Switching (MPLS) network monitoring
- Troubleshooting of network operation
![]() IP SLA measurement uses a variety of operations and actively generated traffic probes to gather many types of measurement statistics:
IP SLA measurement uses a variety of operations and actively generated traffic probes to gather many types of measurement statistics:
- Network latency and response time
- Packet loss statistics
- Network jitter and voice quality scoring
- End-to-end network connectivity
![]() Multiple IP SLA operations (measurements) can run in a network at one time. Reporting tools use SNMP to extract the data into a database and then report on it.
Multiple IP SLA operations (measurements) can run in a network at one time. Reporting tools use SNMP to extract the data into a database and then report on it.
![]() IP SLA measurements enable the network manager to verify service guarantees, which increases network reliability by validating network performance, proactively identifying network issues, and easing the deployment of new IP services.
IP SLA measurements enable the network manager to verify service guarantees, which increases network reliability by validating network performance, proactively identifying network issues, and easing the deployment of new IP services.
IP SLA Operations
![]() The network manager configures a target device, protocol, and User Datagram Protocol (UDP) or TCP port number on the IP SLA source for each operation. The source uses the IP SLA control protocol to communicate with the responder before sending test packets. To increase security on IP SLA measurements control messages, the responder can utilize Message Digest 5 (MD5) authentication for securing the control protocol exchange. When the operation is finished and the response is received, the results are stored in the IP SLA MIB on the source and are retrieved using SNMP.
The network manager configures a target device, protocol, and User Datagram Protocol (UDP) or TCP port number on the IP SLA source for each operation. The source uses the IP SLA control protocol to communicate with the responder before sending test packets. To increase security on IP SLA measurements control messages, the responder can utilize Message Digest 5 (MD5) authentication for securing the control protocol exchange. When the operation is finished and the response is received, the results are stored in the IP SLA MIB on the source and are retrieved using SNMP.
![]() IP SLA operations are defined to target devices. If the operation is something such as Domain Name System (DNS) or HTTP, the target device might be any suitable computer. For operations such as testing the port used by a database, an organization might not want to risk unexpected effects and would use the IP SLA responder functionality to have a router respond in place of the actual database server. Responder functionality can be enabled in a router with one command and requires no complex or per-operation configuration.
IP SLA operations are defined to target devices. If the operation is something such as Domain Name System (DNS) or HTTP, the target device might be any suitable computer. For operations such as testing the port used by a database, an organization might not want to risk unexpected effects and would use the IP SLA responder functionality to have a router respond in place of the actual database server. Responder functionality can be enabled in a router with one command and requires no complex or per-operation configuration.
IP SLA Source and Responder
![]() The IP SLA source is where all IP SLA measurement probe operations are configured either by the command-line interface (CLI) or through an SNMP tool that supports IP SLA operation. The source is also the Cisco IOS device that sends probe packets. The destination of the probe might be another Cisco router or another network target, such as a web server or IP host.
The IP SLA source is where all IP SLA measurement probe operations are configured either by the command-line interface (CLI) or through an SNMP tool that supports IP SLA operation. The source is also the Cisco IOS device that sends probe packets. The destination of the probe might be another Cisco router or another network target, such as a web server or IP host.
![]() Although the destination of the probe can be any IP device, the measurement accuracy is improved with an IP SLA responder. An IP SLA responder is a device that runs Cisco IOS Software and is configured as an IP SLA measurement responder with the ip sla monitor responder configuration command.
Although the destination of the probe can be any IP device, the measurement accuracy is improved with an IP SLA responder. An IP SLA responder is a device that runs Cisco IOS Software and is configured as an IP SLA measurement responder with the ip sla monitor responder configuration command.
IP SLA Operation with Responder
![]() The network manager configures an IP SLA operation by defining a target device, protocol, and port number on the IP SLA source. The network manager can also configure reaction conditions. The operation is scheduled to be run for a period of time to gather statistics. Figure 5-23 shows the sequence of events that occurs for each IP SLA operation that requires a responder on the target:
The network manager configures an IP SLA operation by defining a target device, protocol, and port number on the IP SLA source. The network manager can also configure reaction conditions. The operation is scheduled to be run for a period of time to gather statistics. Figure 5-23 shows the sequence of events that occurs for each IP SLA operation that requires a responder on the target:
- At the start of the control phase, the IP SLA source sends a control message with the configured IP SLA operation information to IP SLA control port UDP 1967 on the target router. The control message carries information such as protocol, port number, and duration:
- If MD5 authentication is enabled, MD5 checksum is sent with the control message.
- If the authentication of the message is enabled, the responder verifies it; if the authentication fails, the responder returns an authentication failure message.
- If the IP SLA measurement operation does not receive a response from a responder, it tries to retransmit the control message and eventually times out.
-
- If the responder processes the control message, it sends an OK message to the source router and listens on the port specified in the control message for a specified duration. If the responder cannot process the control message, it returns an error. In Figure 5-23, UDP port 2020 will be used for the IP SLA test packets.
- If the return code of control message is OK, the IP SLA operation moves to the probing phase, where it sends one or more test packets to the responder for response time computations. The return code is available in the show ip sla statistics command. In Figure 5-23, these test messages are sent on control port 2020.
- The responder accepts the test packets and responds. Based on the type of operation, the responder might add an “in” timestamp and an “out” timestamp in the response packet payload to account for CPU time spent in measuring unidirectional packet loss, latency, and jitter to a Cisco device. These timestamps help the IP SLA source to make accurate assessments on one-way delay and the processing time in the target routers. The responder disables the user-specified port when it responds to the IP SLA measurements packet or when a specified time expires.


IP SLA Responder Timestamps
![]() Figure 5-24 illustrates the use of IP SLA responder timestamps in round-trip calculations. The IP SLA source uses four timestamps for the round-trip time (RTT) calculation. The IP SLA source sends a test packet at time T1.
Figure 5-24 illustrates the use of IP SLA responder timestamps in round-trip calculations. The IP SLA source uses four timestamps for the round-trip time (RTT) calculation. The IP SLA source sends a test packet at time T1.


![]() The IP SLA responder includes both the receipt time (T2) and the transmitted time (T3). Because of other high-priority processes, routers can take tens of milliseconds to process incoming packets. The delay affects the response times because the reply to test packets might be sitting in a queue while waiting to be processed. This timestamping is made with a granularity of submilliseconds. At times of high network activity, an ICMP ping test often shows a long and inaccurate response time, whereas an IP SLA–based responder shows an accurate response time. The IP SLA source subtracts T2 from T3 to produce the time spent processing the test packet in the IP SLA responder. This time is represented by a delta value.
The IP SLA responder includes both the receipt time (T2) and the transmitted time (T3). Because of other high-priority processes, routers can take tens of milliseconds to process incoming packets. The delay affects the response times because the reply to test packets might be sitting in a queue while waiting to be processed. This timestamping is made with a granularity of submilliseconds. At times of high network activity, an ICMP ping test often shows a long and inaccurate response time, whereas an IP SLA–based responder shows an accurate response time. The IP SLA source subtracts T2 from T3 to produce the time spent processing the test packet in the IP SLA responder. This time is represented by a delta value.
![]() The delta value is then subtracted from the overall RTT. The same principle is applied by the IP SLA source where the incoming T4 is also taken at the interrupt level to allow for greater accuracy as compared to T5 when the packet is processed.
The delta value is then subtracted from the overall RTT. The same principle is applied by the IP SLA source where the incoming T4 is also taken at the interrupt level to allow for greater accuracy as compared to T5 when the packet is processed.
![]() An additional benefit of two timestamps at the IP SLA responder is the ability to track one-way delay, jitter, and directional packet loss. These statistics are critical because a great deal of network behavior is asynchronous. To capture one-way delay measurements, the configuration of both the IP SLA source and IP SLA responder with Network Time Protocol (NTP) is required.
An additional benefit of two timestamps at the IP SLA responder is the ability to track one-way delay, jitter, and directional packet loss. These statistics are critical because a great deal of network behavior is asynchronous. To capture one-way delay measurements, the configuration of both the IP SLA source and IP SLA responder with Network Time Protocol (NTP) is required.
![]() Both the source and target need to be synchronized to the same clock source. The IP SLA responder provides enhanced accuracy for measurements, without the need for dedicated third-party external probe devices. It also provides additional statistics, which are not otherwise available via standard ICMP-based measurements.
Both the source and target need to be synchronized to the same clock source. The IP SLA responder provides enhanced accuracy for measurements, without the need for dedicated third-party external probe devices. It also provides additional statistics, which are not otherwise available via standard ICMP-based measurements.
Configuring IP SLA
![]() There are many ways of implementing IP SLA. Different hardware platforms and different IOS versions might have a slightly different approach to IP SLA configuration.
There are many ways of implementing IP SLA. Different hardware platforms and different IOS versions might have a slightly different approach to IP SLA configuration.
![]() Steps to configure IP SLA follow:
Steps to configure IP SLA follow:
|
|
|
|
|
|
|
|
|
|
|
![]() The first step is to use the command ip sla monitor followed by a number to enter in IP SLA configuration mode. The number identifies the SLA test.
The first step is to use the command ip sla monitor followed by a number to enter in IP SLA configuration mode. The number identifies the SLA test.
![]() In Figure 5-25, the IP SLA test is done by sending an ipIcmpEcho message to the IP address 10.1.1.1, from the local interface f0/1. This message is sent every 10 seconds, as shown in the Example 5-7.
In Figure 5-25, the IP SLA test is done by sending an ipIcmpEcho message to the IP address 10.1.1.1, from the local interface f0/1. This message is sent every 10 seconds, as shown in the Example 5-7.
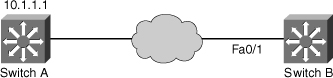
SwitchB(config-sla)# type echo prot ipIcmpEcho 10.1.1.1 source-int fa0/1
SwitchB(config-sla)# frequncy 10
SwitchB(config0sla)# exit
SwitchB(config)# ip sla monitor schedule 11 life forever start-time now
SwitchB(config)# track 1 ip sla 11 reachability
![]() The 10.1.1.1 device should be configured to answer this message with the ip sla responder command.
The 10.1.1.1 device should be configured to answer this message with the ip sla responder command.
![]() At this point, the type of message is configured, along with its frequency and target address. The next step is to decide when this test should start. This is configured with the ip sla monitor schedule command. In Example 5-7, the test is to start immediately and to last forever.
At this point, the type of message is configured, along with its frequency and target address. The next step is to decide when this test should start. This is configured with the ip sla monitor schedule command. In Example 5-7, the test is to start immediately and to last forever.
![]() When the IP SLA test has been defined, additional configuration is needed to determine what action should be taken when the test result is received. In Example 5-7, the track command follows the IP SLA test result. Further commands can then be configured to use the track result to decrement interfaces’ priority or activate backup links.
When the IP SLA test has been defined, additional configuration is needed to determine what action should be taken when the test result is received. In Example 5-7, the track command follows the IP SLA test result. Further commands can then be configured to use the track result to decrement interfaces’ priority or activate backup links.
Round Trip Time (RTT) for Index 1
Latest RTT: NoConnection/Busy/Timeout
Latest operation start time: 11:11:22.533 eastern Thu Jul 9 2010
Latest operation return code: Timeout
Over thresholds occurred: FALSE
Number of successes: 177
Number of failures: 6
Operation time to live: Forever
Operational state of entry: Active
Last time this entry was reset: Never
![]() When IP SLA is configured, the test is conducted as per the scheduled configuration. The test might succeed or fail. If you do not monitor the test results, it might fail silently. To display information about the test, use the show ip sla statistics command. It displays, among other parameters, the number of successes and number of failures. It also shows if the test is still being run. In Example 5-8, the sample output shows that the test is still in active state, succeeded 177 times but also failed 6 times when the command was issued. Monitoring these statistics over time can tell you if there is a connection issue discovered through the IP SLA test.
When IP SLA is configured, the test is conducted as per the scheduled configuration. The test might succeed or fail. If you do not monitor the test results, it might fail silently. To display information about the test, use the show ip sla statistics command. It displays, among other parameters, the number of successes and number of failures. It also shows if the test is still being run. In Example 5-8, the sample output shows that the test is still in active state, succeeded 177 times but also failed 6 times when the command was issued. Monitoring these statistics over time can tell you if there is a connection issue discovered through the IP SLA test.
![]() To get more information about a given IP SLA test configuration, use the show ip sla configuration command. Example 5-9 shows a user displaying IP SLA configuration. With show ip sla configuration, you can also verify which IP address is used as a source, what is the size of each packet, and what are the default timeout and frequency for the test.
To get more information about a given IP SLA test configuration, use the show ip sla configuration command. Example 5-9 shows a user displaying IP SLA configuration. With show ip sla configuration, you can also verify which IP address is used as a source, what is the size of each packet, and what are the default timeout and frequency for the test.
IP SLAs, Infrastructure Engine-II
Entry number: 1
Owner:
Tag:
Type of operation to perform: echo
Target address/Source address: 10.1.3.10/10.1.253.1
Type Of Service parameter: 0x0
Request size (ARR data portion): 28
Operation timeout (milliseconds): 5000
Verify data: No
Vrf Name:
Schedule:
Operation frequency (seconds): 5
Next Scheduled Start Time: Start Time already passed
Group Scheduled : FALSE
Randomly Scheduled : FALSE
Life (seconds): Forever
Entry Ageout (seconds): never
Recurring (Starting Everyday): FALSE
Status of entry (SNMP RowStatus): Active
Threshold (milliseconds): 5000
Distribution Statistics:
Number of statistic hours kept: 2
Number of statistic distribution buckets kept: 1
Statistic distribution interval (milliseconds): 20
History Statistics:
Number of history Lives kept: 0
Number of history Buckets kept: 15
History Filter Type: None
Implementing Redundant Supervisor Engines in Catalyst Switches
![]() The Supervisor Engine is the most important component in Catalyst modular switches, which are typically found in the campus backbone and building distribution submodules. If the Supervisor Engine fails, the switch fails to forward traffic. As a result, providing redundancy for the Supervisor Engine is the most critical form of high availability. Not all Catalyst switches are modular, and not all Catalyst switches provide redundant Supervisor Engine capability. The Catalyst 4500 and 6500 families of switches, however, do provide options for redundant Supervisor Engines.
The Supervisor Engine is the most important component in Catalyst modular switches, which are typically found in the campus backbone and building distribution submodules. If the Supervisor Engine fails, the switch fails to forward traffic. As a result, providing redundancy for the Supervisor Engine is the most critical form of high availability. Not all Catalyst switches are modular, and not all Catalyst switches provide redundant Supervisor Engine capability. The Catalyst 4500 and 6500 families of switches, however, do provide options for redundant Supervisor Engines.
![]() Provisioning dual Supervisor Engines within a Catalyst family of switches, as shown in Figure 5-26, ensures high availability by providing redundancy without requiring the deployment of an entire separate switch. This solution is a cost-effective alternative to deploying multiple switches for redundancy. Even in networks that deploy multiple redundant switches, configuring redundant Supervisor Engines adds an extra level of availability assurance.
Provisioning dual Supervisor Engines within a Catalyst family of switches, as shown in Figure 5-26, ensures high availability by providing redundancy without requiring the deployment of an entire separate switch. This solution is a cost-effective alternative to deploying multiple switches for redundancy. Even in networks that deploy multiple redundant switches, configuring redundant Supervisor Engines adds an extra level of availability assurance.


![]() The Catalyst 4500 and Catalyst 6500 families of switches support redundant Supervisor Engines. The Catalyst 6500 family supports redundant Supervisor Engines on all chassis models, whereas the Catalyst 4500 supports redundant Supervisor Engines only in 4057R-E and 4510R-E chassis.
The Catalyst 4500 and Catalyst 6500 families of switches support redundant Supervisor Engines. The Catalyst 6500 family supports redundant Supervisor Engines on all chassis models, whereas the Catalyst 4500 supports redundant Supervisor Engines only in 4057R-E and 4510R-E chassis.
![]() The Catalyst 4500 and Catalyst 6500 families of switches supports the following redundancy features:
The Catalyst 4500 and Catalyst 6500 families of switches supports the following redundancy features:
- RPR (Route Processor Redundancy) and RPR+ (only on Catalyst 6500)
- SSO (Stateful SwitchOver)
- NSF (Non-Stop Forwarding) with SSO
![]() NSF with SSO provides the highest level of high availability in the Catalyst 6500 and Catalyst 4500 families of switches.
NSF with SSO provides the highest level of high availability in the Catalyst 6500 and Catalyst 4500 families of switches.
Route Processor Redundancy
![]() Route Processor Redundancy (RPR) was the first form of high availability feature in Cisco IOS Software starting with Cisco IOS Software Release 12.1(13)E. Although RPR is still available in Cisco IOS, it is no longer the preferred option. NSF with SSO provides better convergence time than RPR or RPR+.
Route Processor Redundancy (RPR) was the first form of high availability feature in Cisco IOS Software starting with Cisco IOS Software Release 12.1(13)E. Although RPR is still available in Cisco IOS, it is no longer the preferred option. NSF with SSO provides better convergence time than RPR or RPR+.
![]() This section briefly reviews the RPR and RPR+ features. The Catalyst 4500 and Catalyst 6500 families of switches support high availability by enabling a redundant Supervisor Engine to take over if the primary Supervisor Engine fails for both Layer 2 and Layer 3 functions. Table 5-2 shows the failover times of RPR and RPR+ on the Catalyst 6500 and 4500 families of switches.
This section briefly reviews the RPR and RPR+ features. The Catalyst 4500 and Catalyst 6500 families of switches support high availability by enabling a redundant Supervisor Engine to take over if the primary Supervisor Engine fails for both Layer 2 and Layer 3 functions. Table 5-2 shows the failover times of RPR and RPR+ on the Catalyst 6500 and 4500 families of switches.
|
|
|
|
|---|---|---|
|
|
|
|
|
|
|
|
![]() The Supervisor Engine involved in forwarding of traffic at both the Layer 2 and Layer 3 levels is called the active Supervisor Engine. The other Supervisor Engine, which is not forwarding traffic but is instead in a standby mode monitoring the active Supervisor Engine, is called the standby Supervisor Engine. The active and standby Supervisor Engines monitor each other through periodic communication for failure.
The Supervisor Engine involved in forwarding of traffic at both the Layer 2 and Layer 3 levels is called the active Supervisor Engine. The other Supervisor Engine, which is not forwarding traffic but is instead in a standby mode monitoring the active Supervisor Engine, is called the standby Supervisor Engine. The active and standby Supervisor Engines monitor each other through periodic communication for failure.
![]() With RPR, any of the following events triggers a switchover from the active to the standby Supervisor Engine:
With RPR, any of the following events triggers a switchover from the active to the standby Supervisor Engine:
- Route Processor (RP) or Switch Processor (SP) crash on the active Supervisor Engine.
- A manual switchover from the CLI.
- Removal of the active Supervisor Engine.
- Clock synchronization failure between Supervisor Engines.
![]() In a switchover, the redundant Supervisor Engine becomes fully operational, and the following events occur on the remaining modules during an RPR failover:
In a switchover, the redundant Supervisor Engine becomes fully operational, and the following events occur on the remaining modules during an RPR failover:
- All switching modules are power-cycled.
- Remaining subsystems on the MSFC (including Layer 2 and Layer 3 protocols) are initialized on the prior standby, now active, Supervisor Engine.
- ACLs based on the new active Supervisor Engine are reprogrammed into the Supervisor Engine hardware.
Route Processor Redundancy Plus
![]() With RPR+, the redundant Supervisor Engine remains fully initialized and configured, which shortens the switchover time if the active Supervisor Engine fails or if the network administrator performs a manual switchover.
With RPR+, the redundant Supervisor Engine remains fully initialized and configured, which shortens the switchover time if the active Supervisor Engine fails or if the network administrator performs a manual switchover.
| Note |
|
![]() RPR+ enhances Supervisor redundancy compared to RPR by providing the following additional benefits:
RPR+ enhances Supervisor redundancy compared to RPR by providing the following additional benefits:
- Reduced switchover time: Depending on the configuration, the switchover time is in the range of 30 seconds to 60 seconds.
- No reloading of installed modules: Because both the startup configuration and the running configuration stay continually synchronized from the active to the redundant Supervisor Engine during a switchover, no reloading of line modules occurs.
- Synchronization of Online Insertion and Removal (OIR) events between the active and standby: This occurs such that modules in the online state remain online and modules in the down state remain in the down state after a switchover.
Configuring and Verifying RPR+ Redundancy
![]() RPR+ redundancy configurations are straightforward, as illustrated in the following steps:
RPR+ redundancy configurations are straightforward, as illustrated in the following steps:
|
|
|
|
|
|
![]() Example 5-10 illustrates a user configuring RPR+ redundancy on a Catalyst 6500 and verifying the configuration. In Example 5-10, the standby supervisor is currently not present; therefore, the peer state is disabled in the display.
Example 5-10 illustrates a user configuring RPR+ redundancy on a Catalyst 6500 and verifying the configuration. In Example 5-10, the standby supervisor is currently not present; therefore, the peer state is disabled in the display.
Enter configuration commands, one per line. End with CNTL/Z.
Switch(config)# redundancy
Switch(config-red)# mode rpr-plus
Switch(config-red)# end
Switch# show redundancy states
my state = 13 –ACTIVE
peer state = 1 -DISABLED
Mode = Simplex
Unit = Primary
Unit ID = 1
Redundancy Mode (Operational) = Route Processor Redundancy Plus
Redundancy Mode (Configured) = Route Processor Redundancy Plus
Split Mode = Disabled
Manual Swact = Disabled Reason: Simplex mode
Communications = Down Reason: Simplex mode
client count = 11
client_notification_TMR = 30000 milliseconds
keep_alive TMR = 4000 milliseconds
keep_alive count = 0
keep_alive threshold = 7
RF debug mask = 0x0
Stateful Switchover (SSO)
![]() RPR and RPR+ recover traffic forwarding of the switch in about a minute after a switchover of the Supervisor Engine; however, RPR and RPR+ disruptions are not transparent to the end user. For example, if the user were using an IP Phone, the call would be dropped. Even though a minute-long outage might not be significant to a typical Internet user, it is critical for IP Phone users or database applications; therefore, this poses the need for a better redundancy protocol to minimize the disruption of traffic. The Catalyst 4500 and Catalyst 6500 families of switches support SSO to provide minimal Layer 2 traffic disruption during a Supervisor switchover.
RPR and RPR+ recover traffic forwarding of the switch in about a minute after a switchover of the Supervisor Engine; however, RPR and RPR+ disruptions are not transparent to the end user. For example, if the user were using an IP Phone, the call would be dropped. Even though a minute-long outage might not be significant to a typical Internet user, it is critical for IP Phone users or database applications; therefore, this poses the need for a better redundancy protocol to minimize the disruption of traffic. The Catalyst 4500 and Catalyst 6500 families of switches support SSO to provide minimal Layer 2 traffic disruption during a Supervisor switchover.
![]() In SSO mode, the redundant Supervisor Engine starts up in a fully initialized state and synchronizes with the startup configuration and the running configuration of the active Supervisor Engine. The standby Supervisor in SSO mode also keeps in sync with the active Supervisor Engine for all changes in hardware and software states for features that are supported via SSO. Any supported feature interrupted by failure of the active Supervisor Engine is continued seamlessly on the redundant Supervisor Engine.
In SSO mode, the redundant Supervisor Engine starts up in a fully initialized state and synchronizes with the startup configuration and the running configuration of the active Supervisor Engine. The standby Supervisor in SSO mode also keeps in sync with the active Supervisor Engine for all changes in hardware and software states for features that are supported via SSO. Any supported feature interrupted by failure of the active Supervisor Engine is continued seamlessly on the redundant Supervisor Engine.
![]() The following list details the current protocols and features that SSO modes support for Layer 2 redundancy. For a complete and up-to-date list, refer to Cisco.com.
The following list details the current protocols and features that SSO modes support for Layer 2 redundancy. For a complete and up-to-date list, refer to Cisco.com.
- 802.3x (Flow Control)
- 802.3ad (LACP) and PAgP
- 802.1X (Authentication) and Port security
- 802.3af (Inline power)
- VTP
- Dynamic ARP Inspection/DHCP snooping/IP source guard
- IGMP snooping (versions 1 and 2)
- DTP (802.1Q and ISL)
- MST/PVST+/Rapid-PVST
- PortFast/UplinkFast/BackboneFast /BPDU Guard and filtering
- Voice VLAN
- Unicast MAC filtering
- ACL (VLAN ACLs, Port ACLs, Router ACLs)
- QOS (DBL)
- Multicast storm control/broadcast storm control
![]() In SSO mode, ports that were active before the switchover remain active because the redundant Supervisor Engine recognizes the hardware link status of every link. The neighboring devices do not see the link-down event during the switchover except the link to the previous active Supervisor. On the Catalyst 4500 switches, the uplink on the previous active Supervisor Engine is also retained even though that Supervisor Engine might be rebooting. In such a case, no spanning-tree topology changes occur because no link states change.
In SSO mode, ports that were active before the switchover remain active because the redundant Supervisor Engine recognizes the hardware link status of every link. The neighboring devices do not see the link-down event during the switchover except the link to the previous active Supervisor. On the Catalyst 4500 switches, the uplink on the previous active Supervisor Engine is also retained even though that Supervisor Engine might be rebooting. In such a case, no spanning-tree topology changes occur because no link states change.
![]() On the Catalyst 6500 family of switches, the time it takes for the Layer 2 traffic to be fully operational following a Supervisor failure is between 0 and 3 seconds.
On the Catalyst 6500 family of switches, the time it takes for the Layer 2 traffic to be fully operational following a Supervisor failure is between 0 and 3 seconds.
![]() On the Catalyst 4500, subsecond switchover can be achieved for Layer 2 traffic. Layer 3 information, however, needs to be relearned after a Supervisor Engine failover with just the SSO mode of redundancy, but the newly active Supervisor Engine continues to use existing Layer 2 switching information to continue forwarding traffic until Layer 3 information is relearned. This relearning involves rebuilding ARP tables and Layer 3 CEF and adjacency tables. Until the routing converges and CEF and adjacency tables are rebuilt, packets that need to be routed are dropped.
On the Catalyst 4500, subsecond switchover can be achieved for Layer 2 traffic. Layer 3 information, however, needs to be relearned after a Supervisor Engine failover with just the SSO mode of redundancy, but the newly active Supervisor Engine continues to use existing Layer 2 switching information to continue forwarding traffic until Layer 3 information is relearned. This relearning involves rebuilding ARP tables and Layer 3 CEF and adjacency tables. Until the routing converges and CEF and adjacency tables are rebuilt, packets that need to be routed are dropped.
Configuring and Verifying SSO
![]() SSO redundancy configurations are straightforward, as illustrated in the following steps:
SSO redundancy configurations are straightforward, as illustrated in the following steps:
|
|
|
|
|
|
![]() Example 5-11 illustrates a user configuring SSO redundancy on a Catalyst 4500 and verifying the configuration.
Example 5-11 illustrates a user configuring SSO redundancy on a Catalyst 4500 and verifying the configuration.
Enter configuration commands, one per line. End with CNTL/Z.
Switch(config)# redundancy
Switch(config-red)# mode sso
Changing to sso mode will reset the standby. Do you want to continue? [confirm]
Switch(config-red)# end
Switch# show redundancy states
my state = 13 –ACTIVE
peer state = 8 -STANDBY HOT
Mode = Duplex
Unit = Primary
Unit ID = 2
Redundancy Mode (Operational) = Stateful Switchover
Redundancy Mode (Configured) = Stateful Switchover
Split Mode = Disabled
Manual Swact = Enabled
Communications = Up
client count = 21
client_notification_TMR = 240000 milliseconds
keep_alive TMR = 9000 milliseconds
keep_alive count = 0
keep_alive threshold = 18
RF debug mask = 0x0
NSF with SSO
![]() The Catalyst 4500 and 6500 family of switches supports another form of redundancy called NSF with SSO.
The Catalyst 4500 and 6500 family of switches supports another form of redundancy called NSF with SSO.
![]() NSF with SSO redundancy includes the standard SSO for Layer 2 switching; however, it also minimizes the amount of time that a Layer 3 network is unavailable following a Supervisor Engine switchover by continuing to forward IP packets using CEF entries built from the old active Supervisor. Zero packet loss or near-zero packet loss is achieved with NSF with SSO redundancy mode.
NSF with SSO redundancy includes the standard SSO for Layer 2 switching; however, it also minimizes the amount of time that a Layer 3 network is unavailable following a Supervisor Engine switchover by continuing to forward IP packets using CEF entries built from the old active Supervisor. Zero packet loss or near-zero packet loss is achieved with NSF with SSO redundancy mode.
![]() When using the NSF with SSO feature, reconvergence of supported Layer 3 routing protocols (BGP, EIGRP, OSPF, and IS-IS) happens automatically in the background while packet forwarding continues. The standby Supervisor Engine maintains the copy of the CEF entries from the active Supervisor Engine, and upon switchover, the new active Supervisor Engine uses the CEF entries while the routing protocol converges without interruption to user traffic. When the routing protocol has converged and the Routing Information Base (RIB) has been built afresh on the route processor, any stale CEF entries are removed, and packet forwarding is fully restored.
When using the NSF with SSO feature, reconvergence of supported Layer 3 routing protocols (BGP, EIGRP, OSPF, and IS-IS) happens automatically in the background while packet forwarding continues. The standby Supervisor Engine maintains the copy of the CEF entries from the active Supervisor Engine, and upon switchover, the new active Supervisor Engine uses the CEF entries while the routing protocol converges without interruption to user traffic. When the routing protocol has converged and the Routing Information Base (RIB) has been built afresh on the route processor, any stale CEF entries are removed, and packet forwarding is fully restored.
![]() Changes have been made to the routing protocols so that upon switchover, an NSF-enabled router sends special packets that trigger routing updates from the NSF-aware neighbors without resetting the peer relationship. This feature prevents route flapping and routing changes during a Supervisor failover. NSF-aware routers understand that a neighboring NSF router can still forward packets when an RP switchover happens. NSF-aware routers are not required to be NSF routers themselves.
Changes have been made to the routing protocols so that upon switchover, an NSF-enabled router sends special packets that trigger routing updates from the NSF-aware neighbors without resetting the peer relationship. This feature prevents route flapping and routing changes during a Supervisor failover. NSF-aware routers understand that a neighboring NSF router can still forward packets when an RP switchover happens. NSF-aware routers are not required to be NSF routers themselves.
![]() For information about the NSF operations for each of the routing protocols, refer to the “Configuring NSF with SSO Supervisor Engine Redundancy” configuration section of the Catalyst 6500 configuration guide at Cisco.com.
For information about the NSF operations for each of the routing protocols, refer to the “Configuring NSF with SSO Supervisor Engine Redundancy” configuration section of the Catalyst 6500 configuration guide at Cisco.com.
![]() In summary, Cisco NSF provides the following benefits:
In summary, Cisco NSF provides the following benefits:
- Improved network availability: NSF continues forwarding network traffic and application state information so that user traffic is not interrupted after a Supervisor switchover.
- Overall network stability: Network stability is improved by maintaining routing protocol neighbor relationships during Supervisor failover.
Configuring and Verifying NSF with SSO
![]() NSF is an additional configuration option for configuring SSO. For an example of how to configure SSO, refer to Example 5-11. To configure NSF for OSPF, EIGRP, and IS-IS, use the nsf router-level command. To configure BGP for NSF support, use the bgp graceful-restart router-level command.
NSF is an additional configuration option for configuring SSO. For an example of how to configure SSO, refer to Example 5-11. To configure NSF for OSPF, EIGRP, and IS-IS, use the nsf router-level command. To configure BGP for NSF support, use the bgp graceful-restart router-level command.
![]() Example 5-12 illustrates a user configuring NSF support for BGP and OSPF and verifying the configuration output.
Example 5-12 illustrates a user configuring NSF support for BGP and OSPF and verifying the configuration output.
Enter configuration commands, one per line. End with CNTL/Z.
Switch(config)# router bgp 100
Switch(config-router)# bgp graceful-restart
Switch(config-router)# exit
Switch(config)#router ospf 200
Switch(config-router)# nsf
Switch(config-router)# end
Switch# show ip bgp neighbors 192.168.200.1
BGP neighbor is 192.168.200.1, remote AS 200, external link
BGP version 4, remote router ID 192.168.200.1
BGP state = Established, up for 00:01:23
Last read 00:00:17, hold time is 180, keepalive interval is 60 seconds
Neighbor capabilities:
Route refresh:advertised and received(new)
Address family IPv4 Unicast:advertised and received
Address family IPv4 Multicast:advertised and received
Graceful Restart Capability:advertised and received
Remote Restart timer is 120 seconds
Address families preserved by peer:
IPv4 Unicast, IPv4 Multicast
Received 1539 messages, 0 notifications, 0 in queue
Sent 100 messages, 0 notifications, 0 in queue
Default minimum time between advertisement runs is 30 seconds
Switch# show ip ospf
Routing Process "ospf 200" with ID 192.168.20.1 and Domain ID 0.0.0.1
Supports only single TOS(TOS0) routes
Supports opaque LSA
SPF schedule delay 5 secs, Hold time between two SPFs 10 secs
Minimum LSA interval 5 secs. Minimum LSA arrival 1 secs
Number of external LSA 0. Checksum Sum 0x0
Number of opaque AS LSA 0. Checksum Sum 0x0
Number of DCbitless external and opaque AS LSA 0
Number of DoNotAge external and opaque AS LSA 0
Number of areas in this router is 1. 1 normal 0 stub 0 nssa
External flood list length 0
Non-Stop Forwarding enabled, last NSF restart 00:02:36 ago (took 34 secs)
Area BACKBONE(0)
Number of interfaces in this area is 1 (0 loopback)
Area has no authentication
SPF algorithm executed 3 times
0 comments
Post a Comment